9 results
3rd grade mental math Common Core 5.MD.B.2 resources
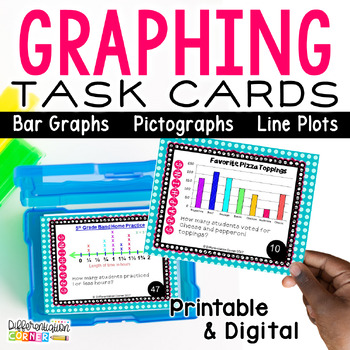
Graphing Task Cards: Line Plots, Bar Graphs and Pictographs Graphing Activities
Practicing data and graphing? This set of Graph Task Cards will help students read and interpret line plots, bar graphs, and pictographs. Use these cards as a graphing game in whole group or use as graphing practice in a math center!There are 60 unique printable & digital cards practicing Common Core Standards covering measurement and data for three types of graphs.I have them laminated in a basket for students to use during math center time. They work with partners, record their answer for
Subjects:
Grades:
3rd - 5th
Types:
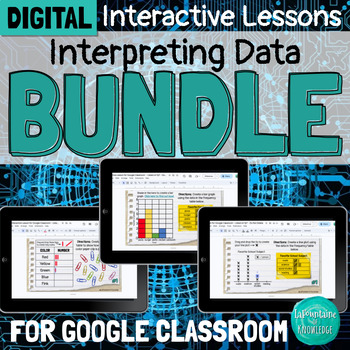
DIGITAL Interpreting Data Interactive Lesson Bundle for Google Classroom
This bundle of 3 digital interactive math lessons for Google Classroom teaches interpreting categorical and numerical data using frequency tables, bar graphs, and line plots. Each lesson includes: a video lesson (YouTube and Loom viewing options included) practice problems and activitiesteacher directions and answer keysThese lessons are ready to assign and easy for students to complete independently. Students will learn:important vocabulary - title, categories, tally marks, key, categorical dat
Subjects:
Grades:
3rd - 5th
Types:
Capacity Task Cards Standard Measurement:Gallons, Quarts, Pints, Cups
Use these 28 capacity conversion task cards to assess whether your students have the concept of capacity conversion mastered.
Your students will convert between gallons, quarts, pints, cups.
Get your students moving in a fun game of SCOOT or use in a math center.
Included are SCOOT GAME directions and Mind-Break Cards if you have more students than cards. Also this product includes an answer sheet for students to record answers and an answer key for you to check their work.
****These TASK C
Subjects:
Grades:
3rd - 6th
Types:

Line Plots Interpreting Categorical and Numerical Data Google Slides Lesson
This Google Slides math lesson introduces students to line plots that are used to organize, graph, and interpret both categorical and numerical data. It also includes scaled line plots. This lesson:reviews frequency tables as a way of keeping track of dataexplains the parts of a line plot including title, categories, and keydemonstrates how to create a line plot using the data from a frequency table by adding x's to represent the dataexplains the difference between categorical and numerical data
Subjects:
Grades:
3rd - 5th
Types:
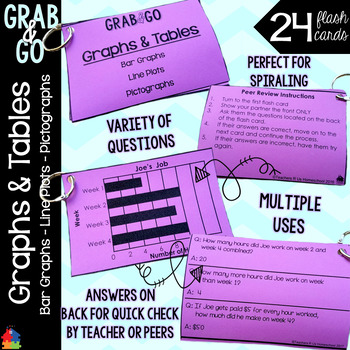
Bar Graphs, Line Plots, Pictographs Grab & Go Flash Cards
Grab & Go Flash Cards are quickly accessible, pocket-sized flash cards that cover a variety of math concepts and can be solved mentally. They are different than task cards in two ways:
1) Grab & Go Flash Cards often pose different questions in regards to the same information presented
2) Grab & Go Flash Cards have the answers on the back for quick assessment by teacher or peers.
Click HERE to read about how I use this product in creative ways.
Skills include:
• Reading and an
Subjects:
Grades:
2nd - 5th
Types:
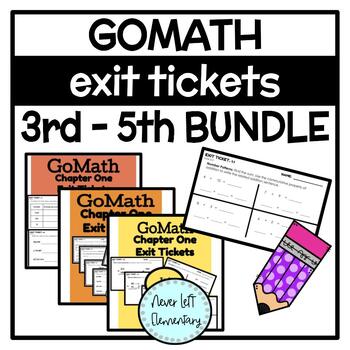
GoMath Exit Tickets - Third, Fourth, and Fifth Grades BUNDLE
Need a quick check-in at the end of your math time? Exit Tickets are a fantastic option!These exit tickets cover every section and chapter of GoMath for third, fourth, and fifth grades. There are two exit tickets on each slide of each section, meaning that you can make five copies of a page and have ten exit tickets ready for class time (also, saves you paper!). Answer key is included.Ranging from multiplying fractions to finding volume, these exit tickets cover a variety of math standards!This
Subjects:
Grades:
3rd - 5th
Types:
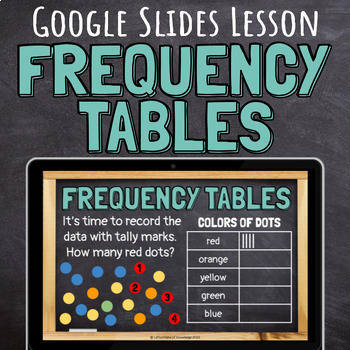
Frequency Tables Interpreting Categorical and Numerical Data Google Slides
This Google Slides math lesson introduces students to frequency tables that are used to organize and interpret both categorical and numerical data. This lesson:explains the parts of a frequency table (title, categories, tally marks)demonstrates how to count tally marks explains the difference between categorical and numerical dataprovides questions to practice interpreting both types of data (just click to reveal the answers) models how to create a frequency table to organize and display dataThe
Subjects:
Grades:
3rd - 5th
Types:
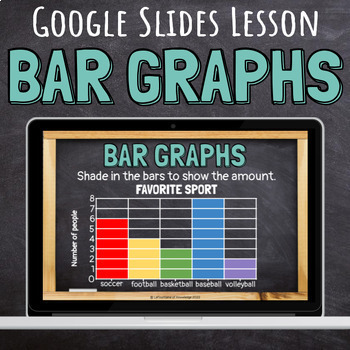
Bar Graphs Interpreting Categorical and Numerical Data Google Slides Lesson
This Google Slides math lesson introduces students to bar graphs that are used to organize and interpret both categorical and numerical data. It also includes scaled bar graphs. This lesson:reviews frequency tables as a way of keeping track of dataexplains the parts of a bar graph including title and categoriesdemonstrates how to create a bar graph using the data from a frequency table by shading in the bars explains the difference between categorical and numerical dataprovides questions to prac
Subjects:
Grades:
3rd - 5th
Types:
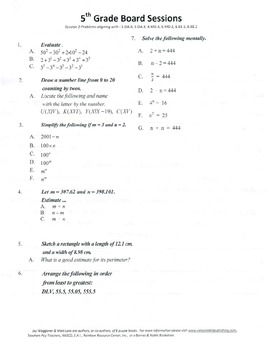
5th Grade Board Session 2, Common Core Necessities and Review
In this Board Session students will…
-add and subtract whole numbers
-work with exponents simplifying expressions
-order numbers on a number line
-substitute for variables, then simplify
-estimate ugly looking binary operations
-solve equations mentally
We DO have a complete set of the 20 5th Grade Board sessions listed, and at a discount from the individual sessions multiplied by 20. For ease in finding it you might want to try copying: 5th Grade Board Sessions, Complete Set of 2
Subjects:
Grades:
3rd - 6th
Types:
Showing 1-9 of 9 results


