10 results
8th grade Common Core 6.SP.B.4 bulletin board ideas
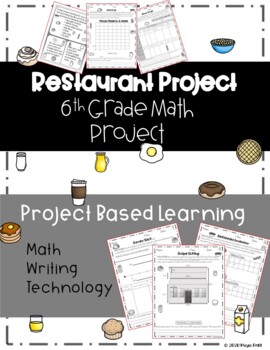
Restaurant Project Math SDI (Project Based Learning, Differentiated) 6th Grade
Mathematics Matters To Me - Project Based Learning, Differentiated, Google Classroom, and Distance LearningThis math project is geared towards turning your lessons into REAL WORLD examples and problems. Engagement for this project will be astounding because your students will have a chance to use what they've learned in your class and apply it to something they love ... food! This project-based learning activity is an AMAZING task for early finishers or enrichment. It would also be perfect for b
Subjects:
Grades:
5th - 8th
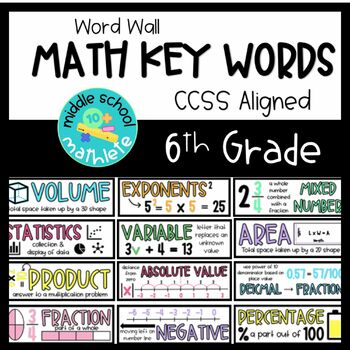
6th Grade MATH Word Wall - Key Words
GRADE 6 WORD WALL MATH KEY WORDS!!!!103 math key terms that align with CCSS. Sorted by the five domains in sixth grade math: ratios & proportional relationships, the number system, expressions & equations, geometry, and statistics & probability. Includes: 103 key word cards, 5 domain postersPrint in color, laminate and hang on walls for student access. Attach magnets or velcro on the back of each card to use on any board or wall so students are able to remove and use at their desks w
Subjects:
Grades:
4th - 8th
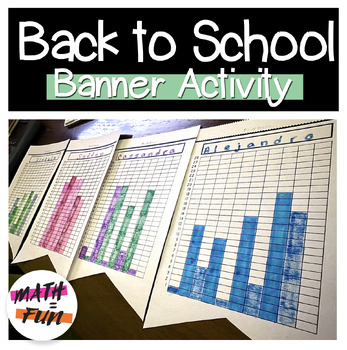
Back to School Name Banners | First Day of School Bar Graph Practice
What Is This?This back to school activity is a low-prep (for teachers), low-risk (for students) review activity–great for easing everyone back into the math classroom! These pennants are great for doubling as classroom decor and getting student work up on the walls right away. (Perfect if you're like me and have Back to School night the second week of school!)What is Included?Banners in 3 versions: names up to 10 letters, names up to 15 letters, and names up to 20 letters.A code page with each l
Subjects:
Grades:
4th - 8th
CCSS:
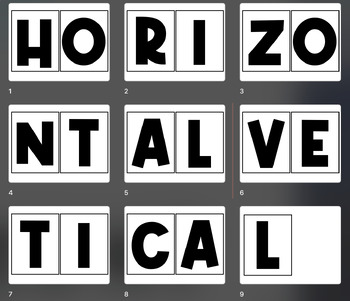
Horizontal and Vertical Posters
Horizontal and Vertical Posters for the corners of your classroom. These are super helpful during graphing units, referencing page orientation, and in general conversation with your students. They are a great visual representation in your classroom for decorations on corners of doorways/whiteboards or even a bulletin board. *The PDF pages are set up as a standard legal sized piece of paper.
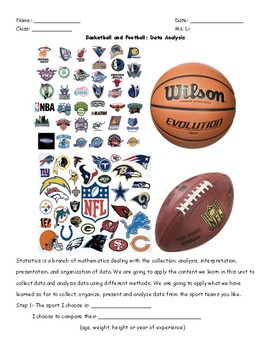
My Favorite Sport Team - Data analysis
This is a great two-days activity for students to do in class or at home. They search for their favorite sport team members and collect data from researching online. After collecting data, they use different representations to present data and analyze data, such as histogram, box and whisker, dot plot.
Subjects:
Grades:
6th - 8th
Class Average Mastery Tracker Displays BUNDLE - 6th, 7th, & 8th (PreAlgebra)
This bundle includes mastery tracker to display your 6th, 7th, 8th Grade (Pre-Algebra) class averages by standard. This editable resource was created using Google Slides and is a digital download. One page is provided for each of the 6th, 7th, and 8th grade common core math standards. Standards with sub-standards (a, b, c, etc) are also on their own pages. This digital download is editable so that you can adjust it to fit your individual classroom needs. All 3 master trackers have been combined
Subjects:
Grades:
6th - 8th
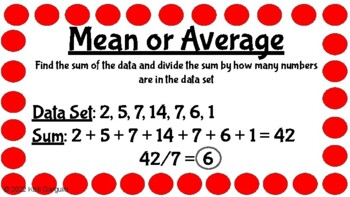
Data and Statistics Posters (Mean/Median/Mode/Range)
Help your students learn Mean, Median, Mode and Range with these step by step posters. Examples are also given on each poster. Great resource to put up in your classroom.
Subjects:
Grades:
5th - 8th, Adult Education
CCSS:
Statistics and Probability - Word Wall
6th, 7th, and 8th Grade Vocabulary Word Wall Words
Subjects:
Grades:
6th - 8th
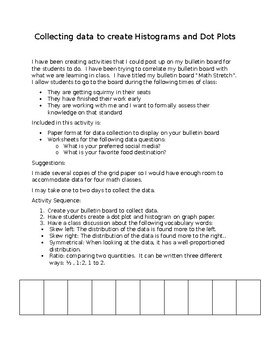
Creating Histograms and Dot Plots
Have students practice creating histograms and dot plots with data that they can relate to.
What is your preferred social media?
What is your preferred food destination?
Create an interactive bulletin board to give students a stretch from their lesson.
Grades:
6th - 8th
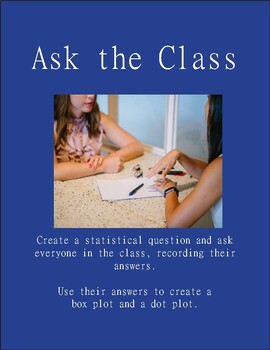
Ask the Class - surveying, box plots, normal curve, probability, correlation
Students will create their own statistical question and ask everyone in the class. They will use their data to draw a box plot and a dot plot. This is an introduction to what qualifies as a "statistical" question. There is an extension for high school math on pages 3, 4 and 5 that goes into correlation, normal curves and probability.
Subjects:
Grades:
6th - 11th
Also included in: 6th Grade Math Bundle
Showing 1-10 of 10 results

