8 results
3rd grade oral communication graphing webquests
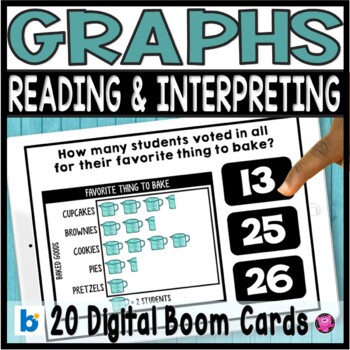
Reading Pictographs - Picture Graphs - Reading and Interpreting Data
These DIGITAL Picture Graphs are a super fun and interactive math activity for your 1st, 2nd, and 3rd grade students to practice reading, analyzing, and interpreting data! Students will answer use picture graphs, and bar graphs to answer questions like: most/least favorites, totals for each group, and compare, analyzing, and interpreting data. Boom Card can be used with Google Classroom, SeeSaw, ClassDoJo and other platforms. Click here to SAVE 20% on my Graphing Bundle!PLEASE NOTE YOU ARE PURCH
Subjects:
Grades:
1st - 3rd
Types:
Also included in: Kindergarten Math Worksheets Games and Centers YEAR-LONG BUNDLE
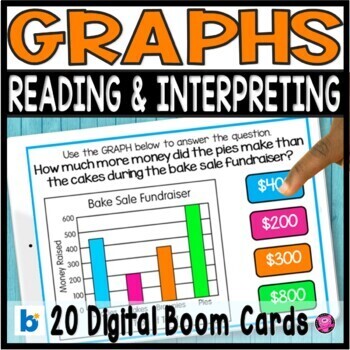
Bar Graphs and Picture Graphs Reading & Analyzing Data Digital Boom Cards
Teaching second and third grade students how to read and interpret data, solve one- and two-step "how many more" and "how many less" problems using information presented in scaled bar graphs will be fun and engaging using these 20 DIGITAL Boom math tasks! Students will practice common core 3.MD.B.3 graphing activities using multiple representations of graphs including data tables, bar graphs, line graphs, and pie graphs. The questions are differentiated for a wide range of learners.Click here to
Subjects:
Grades:
2nd - 3rd
Types:
Also included in: Graphing and Date Analysis Reading and Interpreting Graphs and Data
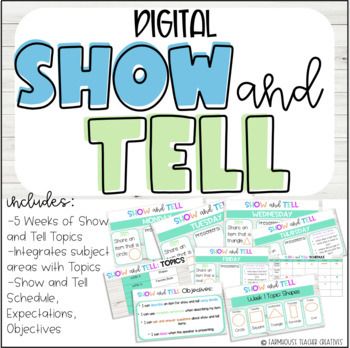
Show and Tell (Digital Slides)
This digital product is a no-prep speaking and listening student-centered activity. This product integrates math (geometry/shapes), literature genre (students discussing their favorite books), colors, phonics (beginning/initial letters), and health. Each topic includes open-ended questioning to scaffold students’ show and tell. More About This Product:The slides include clear, concise directions, rules, expectations, and objectives. In addition, the slides include an editable schedule to determi
Grades:
K - 5th
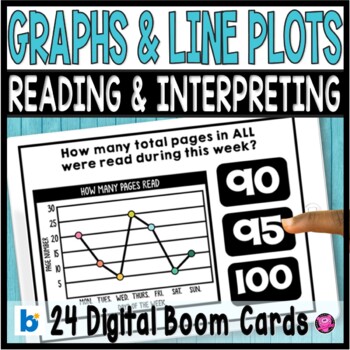
Graphing and Data - Bar Graphs Line Plots Pictographs 3rd Grade DIGITAL Tasks
Teaching your 3rd and 4th grade students how to read, interpret, and analyze dat data using bar graphs, line plots, and picture graphs will simple and easy using these 24 DIGITAL math tasks. Students will practice answering questions like: "how many more", "how many less", and "compare data" using line plots and pictographs. Boom Card can be used with Google Classroom, SeeSaw, ClassDoJo and other platforms. Click here to SAVE 20% on my Graphing Bundle!PLEASE NOTE YOU ARE PURCHASING A LINK TO ACC
Subjects:
Grades:
1st - 3rd
Types:
Also included in: Graphing and Date Analysis Reading and Interpreting Graphs and Data
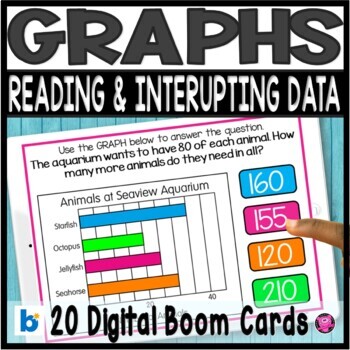
Reading and Interpreting Graphs DIGITAL Task Cards | Graphing
Do your students need teaching and practice activities for reading and interpreting horizontal and vertical bar graphs? This is a set of 20 DIGITAL Boom task cards for students to practice reading and interpreting HORIZONTAL and VERTICAL bar graphs with increments of 5. Students will answer questions like: "how many more", "how many less", and "compare data" about Aquarium Animals. Great for math centers/stations, whole group teaching, small groups, and even assessments! Boom Card can be used wi
Subjects:
Grades:
1st - 4th
Types:
Also included in: Graphing and Date Analysis Reading and Interpreting Graphs and Data
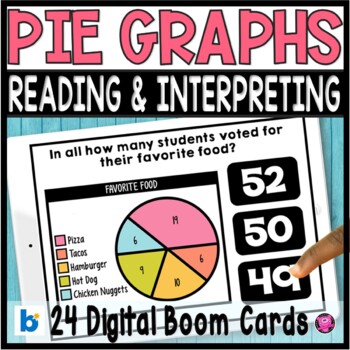
Pie Graphs Interpreting and Reading Data - Digital Boom Cards Pie Graphs
Teaching students how to read and interpret data, solve one- and two-step "how many more" and "how many less" problems using information presented in scaled bar graphs and pie graphs will be fun and engaging using these 24 DIGITAL Boom math tasks! Students will practice common core 3.MD.B.3 graphing activities using multiple representations of graphs including data tables, bar graphs, line graphs, and pie graphs. The questions are differentiated for a wide range of learnersClick here to SAVE 20%
Subjects:
Grades:
1st - 3rd
Types:
Also included in: Graphing and Date Analysis Reading and Interpreting Graphs and Data
Coordinate Plane Practice
This was a perfect way to reintroduce my class to coordinate planes, they had so much fun plotting points and finding the ordered pair through this powerpoint, it is full of games, videos, a web quest, and some practice questions.
Was originally made for Google Slides, I would be happy to share the link with you after purchasing, just message me!
Grades:
3rd - 9th
Types:
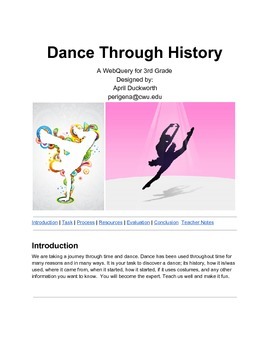
Dance Through History
This is a WebQuery designed to help students learn how to access information on the internet, as they research the history and use of a chosen dance. It says it is designed for third grade however it can be used in grades 3-5 and is adaptable for older grades.
Grades:
3rd - 6th
Showing 1-8 of 8 results


