55 results
Statistics research pdfs
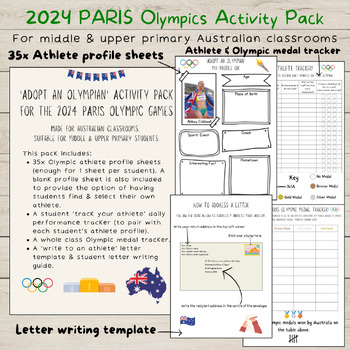
2024 PARIS Olympic Games Activity Pack | Middle & Upper Primary | Australia
Are you an Australian Teacher who is looking for a fun & engaging way to connect your students to the 2024 PARIS Olympic Games? This is the PERFECT resource for you! This activity pack provides students with the opportunity to:Research & profile an Australian Olympic athlete who has been selected to compete at the 2024 Paris Olympic Games.Individually track their athlete over the 19 days of the Olympic Games.Write a personal letter of support to their athlete, to be posted to them at the
Subjects:
Grades:
3rd - 6th
Types:
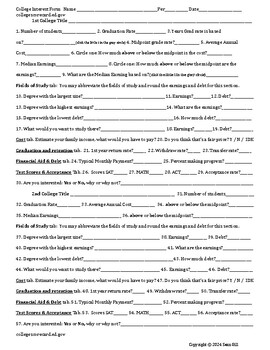
College Research Project Unit
This is an excellent unit on college research. If your school is college focused or you just need a interested based project to get the students engaged, this is a great way to get kids interested in colleges and their stats. Did you know that the federal government compiles all the FAFSA data? It keeps track of how much money each person who filled out a FAFSA makes over the long term (10 years+). There is a wealth of data on every college that has ever accepted federal funding and it is all at
Subjects:
Grades:
6th - 12th
Types:
Superbowl Statistics, Graphing Project with Writing Prompt 3-5
****NEWLY UPDATED*****
This project has students selecting a team that will win the Superbowl, then using statistics from the season and graphing to PROVE their team will win. The document lists requirements, types of graphs and ideas for ways to show data with the team's season statistics. Teachers/students will need to go to the NFL website and research the statistics. Teachers could also print these off for teams to use.
The second half of the project has been added in support of CCSS. Stude

GRAY WOLF MATH PROJECT
Wolf. Wolves. Gray Wolf. Wildlife. Percent Applications. Threatened Species.Connect math to environmental science.Vilified by folklore and popular culture, there probably is no mammal in the world as misunderstood as the gray wolf. As a keystone species it is vital to maintaining a healthy ecosystem. It has largely been exterminated in the United States although recent conservation actions have seen a reintroduction of the gray wolf into Yellowstone National Park. Students will study habitat
Subjects:
Grades:
5th - 8th

Data Collection Survey Project: Grade 7
Students will complete a quantitative data survey of 20 students in the school. They will collect quantitative data and interpret and make conclusions from the data. Part 1 Data CollectionPart 2 Data Analysis Part 3 Data Conclusions & ObservationsPart 4 Reflection
Subjects:
Grades:
7th
Types:
Math- Baseball: A Game of Numbers
In this Exploration, students will examine the statistics of four baseball players. The focus is to understand how the data is calculated. This classic American sport has always used math to keep track of everything that happens in the game. This math Exploration includes detailed, student-friendly Steps to Success that lead the learner through the process of creating a high-level, quality independent project. To add rigor and thoughtfulness, students reflect on their Exploration by answering s
Subjects:
Grades:
3rd - 8th
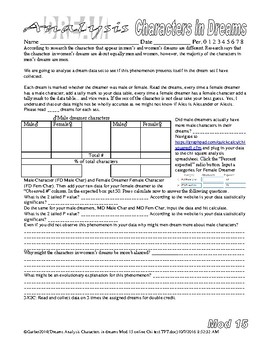
Psychology Dream Analysis Characters and Emotions in Dreams Freud
In these two labs the students analyze a dream set for characters, emotions and animals in dreams respectively. Research says that the characters in women’s dreams are about 50/50, men and women, but in men’s dreams there are more male characters than female characters. One of the labs focuses on this phenomenon. We endeavor to see if this is true in our dream set. The second lab focuses on whether whether or not men or women have more negative or positive dreams. 11/8/22 Animals in dreams is no
Subjects:
Grades:
10th - 12th, Higher Education
Types:
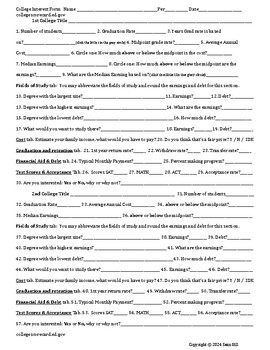
College Interest Form (College Research Unit 1st Lesson)
This is an excellent Introduction to college research. If your school is college focused or you just need a interested based activity to get the students engaged, this is an intriguing assignment that gets kids curious about different colleges and their stats. Did you know that the federal government compiles all the FAFSA data? It keeps track of how much money each person who filled out a FAFSA makes over the long term (10 years+). There is a wealth of data on every college that has ever accept
Subjects:
Grades:
6th - 12th
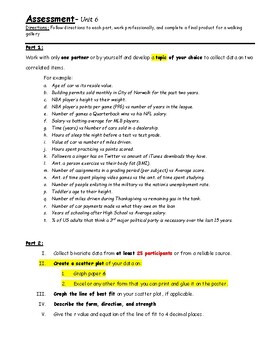
Assessment - Performance Task - Bivariate Data Research
IB Applications & Interpretations SL: End-of-Unit 6 Assessment - Bivariate Data Research Performance Task. Students work in pairs to collect data on two correlated items. After collecting data from 25 participants, students create a scatter plot, line of best fit and analyze the data. Students then perform a gallery walk and answer a series of reflection questions for positive/negative correlation, and zero correlation. Example and grading rubric included
Subjects:
Grades:
10th - 12th
Types:
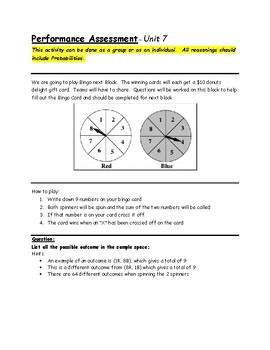
Assessment - Performance Task - Bingo Exploration
IB Applications & Interpretations SL: End-of-Unit Assessment performance task to create bingo cards by analyzing probabilities of numbers that are likely to be selected. Students will then compete in a bingo competition
Subjects:
Grades:
10th - 12th
Types:
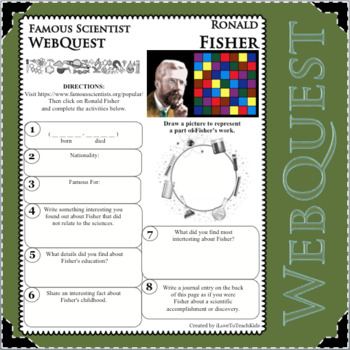
GENETICS Statistics RONALD FISHER Science WebQuest Scientist Research Project
FAMOUS SCIENTIST - Sir Ronald Aylmer Fisher FRS was a British statistician and geneticist. For his work in statistics, he has been described as "a genius who almost single-handedly created the foundations for modern statistical science" and "the single most important figure in 20th century statistics".Engage your learners in fun, interactive, and creative ways to discover more about RONALD FISHER using this WebQuest. Activity is differentiated allowing students to respond to open-ended questi
Subjects:
Grades:
Not Grade Specific
Types:
Also included in: SCIENTISTS 102 WebQuests Science Research Project Biography BUNDLE
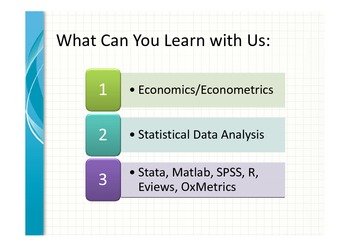
e-Learning AnEconomist Online Course Coupen
Please email this Coupen: TEACHPAYCOUP when you register for the courses in Econometrics, Stata, Matlab, SPSS, Eviews and R. You get 100GBP off the portal fee. Register on http://elearning.aneconomist.com and email on moodle@aneconomist.com ask for discounted invoice for your course. All courses are offered Online, Live and Personalized. Each lecture is recorded and recordings DVD will be provided after the course is completed.
Grades:
11th - 12th, Higher Education, Adult Education, Staff
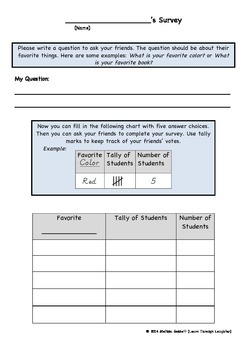
Student Created Survey and Bar Graph
INQUIRY BASED LEARNING! This activity gives students the chance to answer their own burning questions. Examples can include the following: What is the favorite video game of my friends? Do more people in this class like pizza or hamburgers? Which football team is the most popular in this class?
Students are walked through the steps of selecting a topic, gathering data, inserting it into a bar graph, and analyzing the results. It is interesting to see the topics they dream up! This activity can
Subjects:
Grades:
2nd - 3rd
Types:
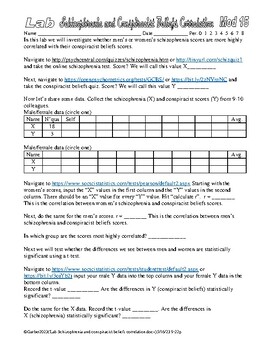
Psychology Schizophrenia and Conspiracist Beliefs Scores Correlation Statistics
In this lab we are finding out if men’s or women’s schizophrenia and conspiracist belief scores are more highly correlated.Students do the schizophrenia quizzes and conspiracist beliefs quiz, collaborate and share data then use a website to conduct the data analysis. It is inspired by this collection… https://www.teacherspayteachers.com/Product/Psychology-Lab-Trolley-Problem-Psychopathy-Scores-Correlation-Statistics-9499523 and the other correlation stuff I have set up…(I have a bunch, these are
Subjects:
Grades:
9th - 12th, Adult Education
Types:
Statistics Debate Project
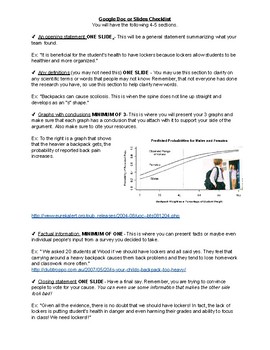
This is a final projects for students to do to end the statistic unit. It allows them to explore real life graphs and use them to build on their side of the argument. Students learn public speaking skills, powerpoint making skills, research skills, and how to read real like graphs.
Subjects:
Grades:
6th - 8th
GRIZZLY BEAR MATH PROJECT
Grizzly Bear. Percent Applications. Math Project. Wildlife. Threatened Species. Connect math to environmental science. Kids love this project!Build awareness with your students around habitat loss for the majestic grizzly while using estimation and percent to calculate population numbers and habitat loss.Students will love learning about this amazing animal while using statistics in a meaningful way.The data for the grizzly populations for Canada and the United States is current and includes
Subjects:
Grades:
5th - 8th
Analyzing Mario Kart: A Statistical Journey through Racing Fun
In this AP Statistics project, we will delve into the world of Mario Kart and apply statistical analysis to gain insights into the game mechanics and player performance.The objective of this project is to explore different statistical concepts and techniques while using data from Mario Kart races. We will investigate factors that may influence race outcomes, such as character selection, track features, and player skill level. Through data analysis and hypothesis testing, we will uncover patterns
Subjects:
Grades:
11th - 12th
Statistics: 99% of You Are Teaching It WRONG! Measures of Central Tendency
Greetings phrens: this is a 41 page guide to how to think about the basic measures of central tendency in statistics (mean, median, mode and range) beyond the basic recitation of "here's how to do it."
If you think about it, statistics is one of the most important and relevant area of mathematics that we teach. It is powerful because it allows us to take large amounts of data and and distilling it down into just a few numbers. However, very often these numbers are either irrelevant, non-repres
Subjects:
Grades:
Not Grade Specific
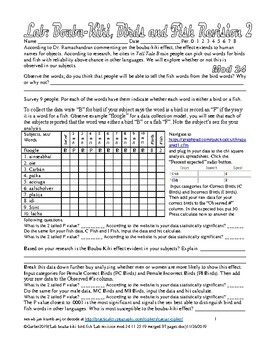
Psychology Lab Bouba Kiki Bird Fish lab Cognition Language
According to Dr. Ramachandran, commenting on synesthesia and the bouba-kiki effect, the effect extends to human names for objects. According to research he cites in Tell Tale Brain, people can pick out words for birds and fish with reliability above chance in other languages. We will explore whether or not this is observed in our population.Survey 24 non-psych friends. For each of the words have them indicate whether each word is either a bird or a fish.This is cool because my students almost al
Subjects:
Grades:
9th - 12th, Higher Education, Adult Education
Types:
Math- Olympic Math:Using Math to Evaluate Sports Performances
Students will look at the Olympic games through a mathematical lens. Using their mathematical thinking they will use data and research to create graphs and story problems. If you are doing this Exploration during an Olympic year, students can use the data from this year. If there are no Olympics happening this year, choose a historic Olympics to analyze.This math Exploration includes detailed, student-friendly Steps to Success that lead the learner through the process of creating a high-level,
Subjects:
Grades:
3rd - 8th
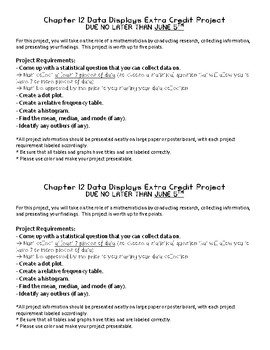
Probability Data Displays Project
This project was used as an extra credit project that ties in with chapter 12 of the 6th grade Go Math program. This project focuses on data displays, including dot plots, frequency tables, and histograms. This allowed students to create a statistical question, collect data, and present their findings. This product includes the directions sheet that I gave to my students, and then the students created posters that displayed the required information. There are two directions sheets per page i
Subjects:
Grades:
4th - 8th
Types:
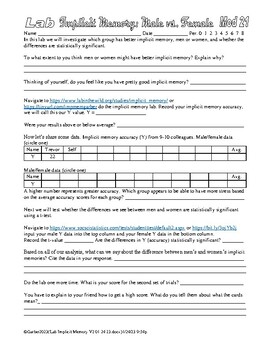
Psychology Lab Implicit Memory Test Cognition Statistics AP Psychology
I did a complete revision of this lab, the old website died. It is now a hard copy. In this lab the students navigate to https://www.labinthewild.org/studies/implicit_memory/ and do the implicit memory activity. They then collaborate to share data and perform a t-test to find out if the difference between male and female scores is statistically significant. You have managed to find the source of the best Psychology and AP Psychology labs on TPT, go check out my store for other awesome resources
Subjects:
Grades:
9th - 12th, Higher Education
Types:
Gluten Free v Gluten Full--2 Sample T Tests
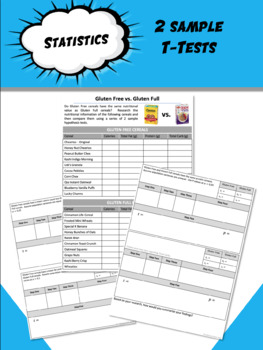
This is math in the REAL WORLD! Part one: Collect DataThe quality and integrity of statistics rests upon the accuracy of your dataPart two: Analyze DataStudents compare Calories, Protein Content, and Fat using 2-sample t-tests. Part Three: Create Your OwnIt's important for students to create and analyze their own research questions, so this give them a chance to come up with a question regarding the Carb content of cereals. *Model answer key is included, but data can vary!
Subjects:
Grades:
10th - 12th, Higher Education, Adult Education
Types:
Data & Statistics Scavenger Hunt
This scavenger hunt requires students to locate 16 different types of graphs. Vocabulary terms are also included, such as "Measures of Central Tendency", "extrapolation," etc. Optional, supplemental, as well as evaluation tools are included. This scavenger hunt could be used a mini-course about basic statistic concepts.
By Math Fan
Subjects:
Grades:
8th - 10th
Types:
Showing 1-24 of 55 results


