33 results
Common Core HSS-ID.B.5 projects
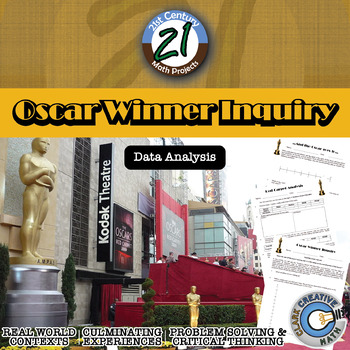
Oscar Winner -- Data Analysis & Statistics Inquiry - 21st Century Math Project
Utilize the last twenty years of Oscar winners as a data set to guide your students through creating box and whisker plots, histograms, and exploring mean, median, and mode -- in one 21st Century Math Project!Does the age of the award winning star in a film relate to the overall gross of the movie? Student will explore this inquiry question and use the data to support their conclusion.In this 8 page document you will be given a mapping to the Content Standards, an outline for how to implement t
Subjects:
Grades:
6th - 12th
Types:
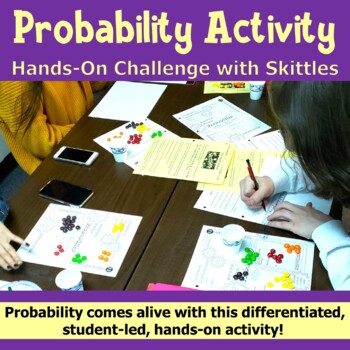
Probability Activity - Hands-On Challenge with Skittles - PBL with Math
Probability comes alive with this differentiated, student-led activity! The Skittles Probability Challenge provides practice using simple and compound probabilities in both theoretical and experimental fashion. Each student is given random data to work with. No two samples are identical. Students will: Make predictions based on logic.Determine the sample size of their personal data.Create a simple or two-way table to organize their data.Construct a graph or box & whisker plot to display the
High School Data Analysis Project
This project covers a large range of data analysis methods. There are eleven total parts to the project.
Part One: the students have to collect data from 20 students outside of the classroom. Directions specify to ask students from each grade level.
Part Two: Measures of Center and Variation. Students will calculate mean, median, mode, range, and standard deviation for some of the data collected. Definitions of each term are included.
Part Three: Box-And-Whisker Plot. Students will create t
Subjects:
Grades:
9th - 12th
Types:
CCSS:

Statistics Survey Project - Project Based Learning (PBL) with Math
Watch your students dive into the world of math as they create, execute, and analyze their own survey! Students will demonstrate mastery of data gathering, survey sampling, developing appropriate survey questions, data tables, Direct Variation, discrete graphs, dot plots, box and whisker graphs, and calculating the inter-quartile range.The Unique Survey Project is highly engaging, capitalizing on the innate curiosity of the adolescent mind. You will love the low-prep instructional guide. Your st
Subjects:
Grades:
6th - 10th
Types:
Also included in: Fun with Ratios Activities Bundle - 7th Grade PBL with Math
AP Statistics
This AP Statistics curriculum bundle contains the following (please take time to preview video and/or individual item previews):Guided Notes and Graphic Organizers (EDITABLE)Exhibition stations (slides) with guided notes (EDITABLE)ActivitiesProjects (EDITABLE)Exams (EDITABLE)Teacher's pacing guide and suggested order for each unit Review in AP style for preparation for the APCOMING: powerpoint with guided notes for each of 9 units NEW! UNIT 1 and UNIT 2 slides and editable notes are currently in
Subjects:
Grades:
10th - 12th
CCSS:
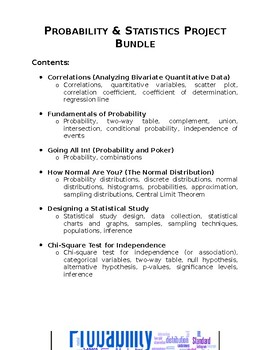
Probability & Statistics Project Bundle
A bundle that contains six different projects for a Probability & Statistics high school course. This bundle includes: Correlations (Analyzing Bivariate Quantitative Data) Fundamentals of Probability Going All In! (Probability, Combinations, and Poker) How Normal Are You? (The Normal Distribution) Designing a Statistical Study Chi-Square Test for Independence These projects are designed to engage students in authentic, hands-on, performance-based tasks. For each of these projects, students c
Subjects:
Grades:
9th - 12th
Types:
CCSS:
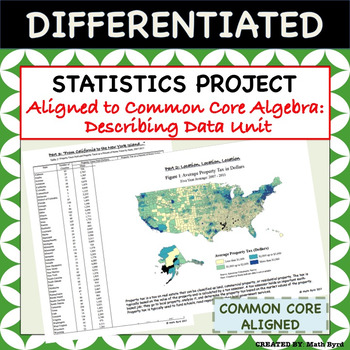
Statistics Project - Aligned to Common Core Algebra - Describing Data Unit
This differentiated U.S. Home Energy & Tax Themed Statistics Project covers all of the "describing data" standards of the Common Core Algebra Course using real data! Students will analyze various forms of tables & graphics to make inferences and interpret the data. The project is perfect for use as a summative assessment since students are required to justify their findings in open-ended format. Allow students to work in pairs, small groups, or individually! A grading rubric and selected
Subjects:
Grades:
8th - 11th
Types:
CCSS:
Also included in: Common Core Algebra 1 PROJECTS - BUNDLE PRICE!
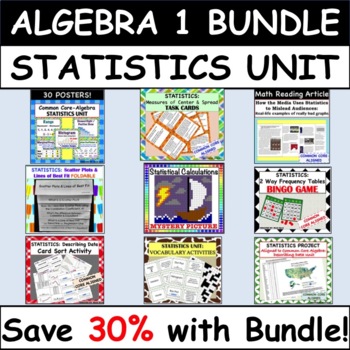
Common Core Algebra 1: STATISTICS UNIT - BUNDLE PRICE!
This Statistics Unit Bundle set includes a wide variety of 10 resources all geared towards the Common Core Algebra 1 course.Resources Included:Culminating Project Based on Real World Data30 PostersCard Sort ActivityMath Reading Article & Follow Up SummaryTask Cards ActivityFoldableMystery Color Picture Activity2 Vocabulary Activities including: Matching definition/vocabulary card set & crossword puzzleBingo GameLine of Best Fit - Class LabDifferentiation:Each resource in the bundle is di
Subjects:
Grades:
8th - 11th
Types:
CCSS:
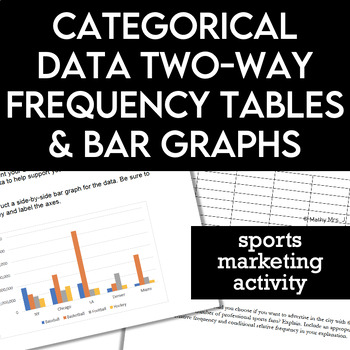
Two-Way Frequency Tables Stacked Bar Graph Sports Marketing Activity
Get students researching and analyzing data with this two-way frequency table activity! Students create side by side bar graphs, stacked bar graphs, calculate frequencies and relative frequencies, and apply their knowledge to a real world situation.How it works: Students gather data to show which sports, teams, and cities have the most sports fans and use the data to make informed decisions about advertising. Students organize the data into tables and graphs and practice finding join, marginal a
Subjects:
Grades:
7th - 10th
Types:
CCSS:
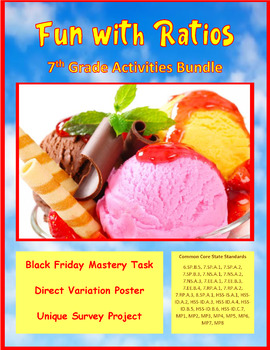
Fun with Ratios Activities Bundle - 7th Grade PBL with Math
The purpose of the Fun with Ratios Activities Bundle is to give students the opportunity to use creativity to apply ratios, proportions, and percentages in real-world settings. This bundle includes three unique tasks: Black Friday Mastery Task, Direct Variation Poster Mastery Task, and the Unique Survey Project. These activities and their accompanying materials are suited for students in grades 7 through 9. These lessons make excellent sub plans. Each project takes approximately two 60-minute bl
Subjects:
Grades:
7th - 9th
Types:
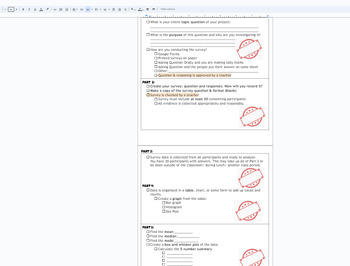
Statistics Survey project Discovery (broken down into sections) with Rubric
This is a broken down (scaffolded) packet of instructions/ guide for a Stats Project for Math 1 HS or 8th grade students. The goal of the project is for students to take a statistical survey on quantitative data (numbers) of their choice. Using this data from the survey, the following will be included in the project:Survey- the question being askedSurvey responses (requirement of 30)Data organization: Bar chart, Histogram, Dot PlotMeanMedianModeBox and Whisket Plot5 number summary (Q1,Q2,Q3, min
Subjects:
Grades:
7th - 12th, Higher Education, Adult Education
CCSS:
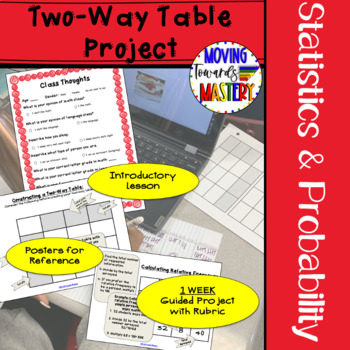
Two Way Frequency Tables End of Year Project Plan
ONE Week guided project plan for constructing and interpreting two-way frequency tables. This engaging project is individualized to allow students to research areas of interest. Can be used year round but is great for an end of year project! Students will gather data on their topic of choice and use the project plan to organize their data into a two way table and frequency table. Students will then analyze the results of the data collection.Two-Way Table Project includes:♦ Suggested Lesson Plann
Subjects:
Grades:
8th - 10th
Types:
CCSS:
Also included in: Middle School Math Projects for End of the Year Activities
Which Quarterback is the G.O.A.T.? - Using Statistical Calculations
Note: This is an upgraded version of the Statistical Analysis Using Football (QB) Stats. If you have previously purchased this resource please email me and I will send you the updated version.This project has students calculate percents, averages, and ratios, as well as create scatterplots, box and whisker plots, and histogram (bar graphs) based on their calculations.Google slideshow includes 12 well know Hall of Fame quarterbacks including Joe Namath, Roger Staubach, Terry Bradshaw, Joe Montana
Subjects:
Grades:
6th - 9th
CCSS:
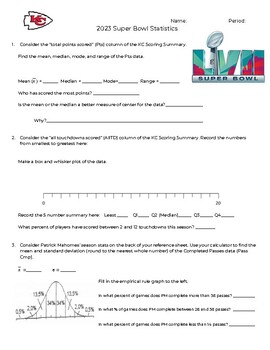
2023 Super Bowl Statistics Activity
This activity contains two stats sheets - one for the Philadelphia Eagles and one for the Kansas City Chiefs. Students are asked to use the data from the various tables to answer questions about the teams. This activity covers 1 variable statistics (mean, median, mode, range, standard deviation, box-and-whisker plot, histogram, two-way tables).This would be great as a partner activity or class activity.
Subjects:
Grades:
7th - 12th
Types:
CCSS:
Investigate COVID-19 using Statistics with Real-World Data
Distance Learning: Investigate COVID-19 using Statistics with Real-World Data (Common Core) This digital activity created in Google™ Slides involves analyzing real surveillance data on COVID-19 as a member of a team of scientists. Students will convert a summary of categorical data into a two-way frequency table. Next, students will investigate the relation between two variables within a population of adults hospitalized with COVID-19. COVID-19 has directly affected students’ lives and presents
Subjects:
Grades:
8th - 12th
Types:
CCSS:
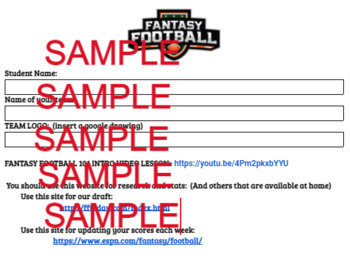
Statistics Fantasy Football Project
High School and Middle School Statistics Class Project. Fantasy Football is played by an estimated 25 to 30 million people each year and in this project our students will be part of the action! Don't worry, if you don't know one thing about football you will do fine with this project! Each student will become an owner and draft their own players for different positions. Each owner must draft on quarterback, one running back, two wide receivers, and one tight end and keep track of their stats
Subjects:
Grades:
7th - 12th, Higher Education
Types:
CCSS:
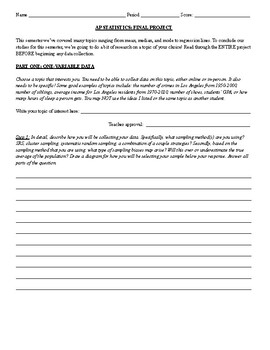
AP Statistics Project: Normal Distributions, Regression Analysis, and Sampling
If you are looking for a cumulative project that summarizes the three topics relating to: one-variable data analysis, two-variable data analysis, and sampling methods, this is a great project to provide to your regular or AP Statistics students. Topics covered in this project include normal distributions, scatterplots, correlation, regression analysis, sampling methods, sampling biases, and statistical thinking. It covers Unit 1, Unit 2, and Unit 3 materials in the AP Statistics suggested course
Subjects:
Grades:
11th - 12th
Types:
CCSS:
Also included in: AP Statistics / High School Statistics Projects
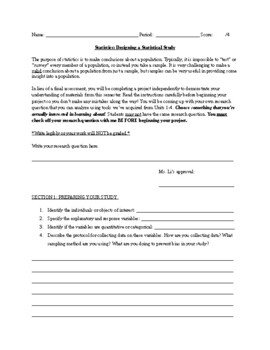
Statistics Project: Designing a Linear Regression Analysis (High School)
Updated as of 5/28 with graphic organizers and sentence starters. Hello!I've designed a statistics project that students in my class loved! This project requires students to collect data on a topic that interests them. They have to design a sampling method that is as unbiased as possible. Students are then required to analyze their data and summary statistics. They also need to do a regression analysis on their study and make inferences using their results. This is perfect for a replacement of
Subjects:
Grades:
9th - 12th, Higher Education
Types:
CCSS:
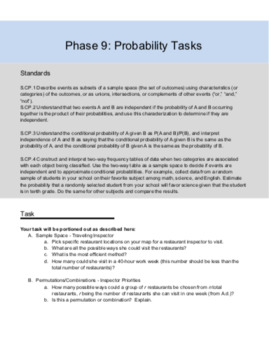
HS Geometry City Restaurant Inspector Project - Probability
This project leads student through the Probability unit of Geometry in learning about Fundamental Counting Principle, Permutations and Combinations, Compound Events, and Two-way Frequency Tables. Students will follow a restaurant inspector through the city they designed (free resource here) to demonstrate these concepts.This purchase includes a task sheet for students describing the project, a report template for students to provide their information, a rubric, tips on helping students with rese
Subjects:
Grades:
9th - 12th
CCSS:
Also included in: HS Geometry City Design Bundle
Investigate COVID-19 Disparities with Probability and Real Data
Distance Learning: Investigate COVID-19 Disparities Using Probability with Real-World Data (Common Core)If you have been observing the intersection of world events involving COVID-19 and racial justice and believe this to be an unmissable teachable moment, you are not alone. Finding ways to address these important topics in a STEM class can be challenging. However, given the extensive media coverage of these events, many of which include data, COVID-19 and racial justice are immediately relevant
Subjects:
Grades:
10th - 12th
Types:
CCSS:

Teaching with Baseball Statistics
I use this activity to teach my science students how to model an idea using data. Students learn to predict the outcomes of a baseball pitcher based on their last 3 years of stats. Students learn to analyze their data and determine trends in the data. Students also learn to compare data from their pitcher to other students' pitchers (collaboration). Students also must be able to/learn to accurately graph their data. There is also a research component as students must research their pitcher's
Data Analysis Full Project
This bundle has all you need to assign and create your own version of the data analysis project. Includes: powerpoint overviewrubricworksheetgoogle form for data collection excel document for teacher to keep track Examples of project - poster and worksheet
Subjects:
Grades:
9th - 12th
Types:
CCSS:
Bivariate Data Analysis Project
First and most importantly this project is easily applicable to different data sets!!!!
I created this project to look at real data that hit home to students. We explored variables that they chose. We decided to analyze the relationship between scholar dollars and GPA (I have included a second relation as well).
Scholar dollars are like merits and demerits. At my school it was a system created as a way for students to track behavior and progress. Student would earn or lose these dollars base
Subjects:
Grades:
7th - 9th
Types:
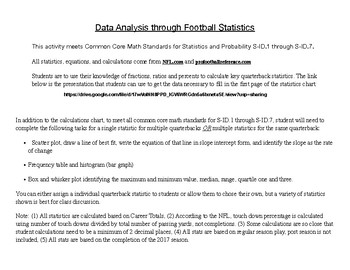
Statistical Analysis using Football (Quarterback) Stats
Are your students interested in football? Get them excited about math and statistics while pursuing hall of fame quarterbacks.This project covers Common Core Math Standards for S-ID.1 through S-ID.7. It includes slide show with NFL stats, 2 page stats calculation chart, data analysis quiz and all necessary answer keys.A fun way to get students into doing math.
Subjects:
Grades:
6th - 10th
Types:
CCSS:
Showing 1-24 of 33 results

