10 results
Elementary graphing laboratories for Google Apps
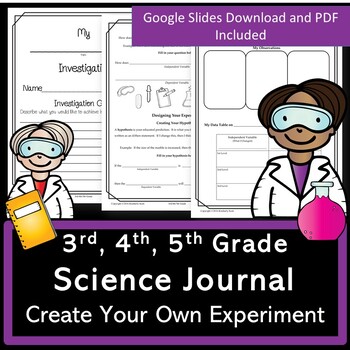
Science Experiment Journal Template | Digital Or Print | Grades 3 4 5
Are you looking to create hands-on investigations with your upper elementary students? Help students think like a scientist using a lab report template. Included are a student-editable Google Slide document and a PDF version. We will take you step by step in designing unique experiments on the topic of your choice. A Google Slide version is included. We feel this journal is great to assign students to perform an experiment at home. During this time of digital learning, students can use suppli
Subjects:
Grades:
3rd - 6th
NGSS:
3-5-ETS1-3
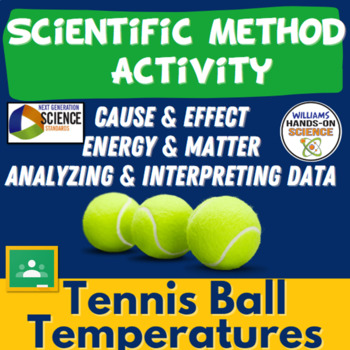
Scientific Method NGSS Crosscutting Concepts Activity & PowerPoint
Students will have a great time learning about science skills, experimental design, NGSS Cross Cutting Concepts, and NGSS Science and Engineering Processes with this resource! And it's Google Ready! It's packed with teacher notes to make your job easy!All you need are two tennis balls per group, one meter stick per group and something to keep the tennis balls cold like a cooler or freezer. The data really shows the difference between the bounce of a cold tennis ball and a room temperature ball.
Subjects:
Grades:
5th - 12th
Types:
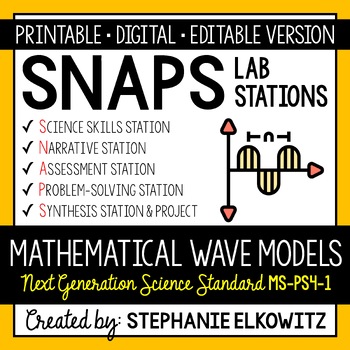
MS-PS4-1 Mathematical Models of Waves Lab | Printable, Digital & Editable
About SNAPs Lab Stations ActivitiesSNAPs Lab Stations Activities require students to use science, math, literacy, problem-solving and engineering skills. They are designed to enhance students' understanding of scientific concepts and help students apply scientific ideas to the real world. Each station activity promotes skills so to develop students into proficient and competent scientific thinkers.SNAPs lab activities have five components:• Science Skills Station to develop science skill profici
Subjects:
Grades:
5th - 9th
Types:
NGSS:
MS-PS4-1
Also included in: Physical Science Lab Stations Bundle | Printable, Digital & Editable
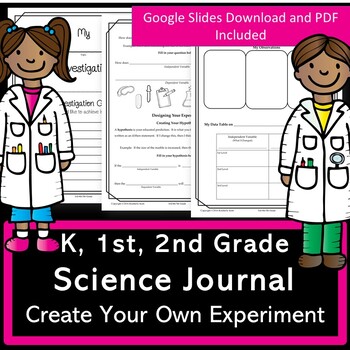
Science Experiment Journal Template | Digital Or Print | Grades K, 1st, 2nd
Create a memorable scientific experience. This blank science experiment template assists adults and students in working together to create a hands-on investigation. Included are a student-editable Google Slide document and a printable version. We will guide you step by step to think like a scientist. We feel this is great for distance learning. This journal is excellent for assigning students to perform an experiment at home. During this time of digital learning, students can use supplies t
Subjects:
Grades:
K - 2nd
NGSS:
K-2-ETS1-3
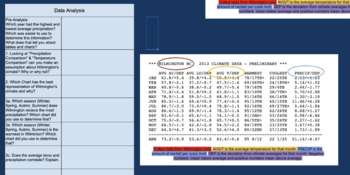
virtual lab collect digital weather data to analyze Climate
Use real data to illustrate weather's relationship with Climate. This data provides the foundation for discussion on the four seasons as well as natural weather events such as hurricanes, El Nino, La Nina, and how it pertains to the North Carolina coast and surrounding states. Each collection, supported by NOAA, provides detail weather data for each month but also a detailed summary of the events from that year. The activity allows for groups or individuals learn the process of collecting month
Subjects:
Grades:
5th - 10th
Types:
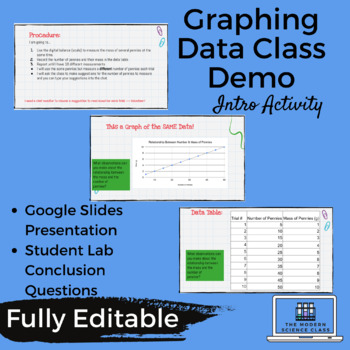
Introduction to Graphing Data - Demo or Lab
Students often don't understand the purpose of collecting data in both tables and graphs. Why not make this the question that they need to investigate.... How can graphing help us interpret lab data? Use this SIMPLE, low-cost activity as either a class demo (hello virtual learning) or small group lab. In this activity students will investigate the relationship between mass and number of pennies in a data table and graph. This resource contains: - A Google Slides presentation walking students &am
Grades:
4th - 8th
Types:

Experimental Design and Graphing; Case Study: For the Sake of Water
Students in this activity will build and analyze a graph from an experiment that a girl conducts in an attempt to sway the city council to tighten restrictions on watering. Students will analyze a problem and experiment for variables, build a graph, and analyze how the data that this girl has collected translates to a recommendation to the city.
Subjects:
Grades:
5th - 8th
Types:
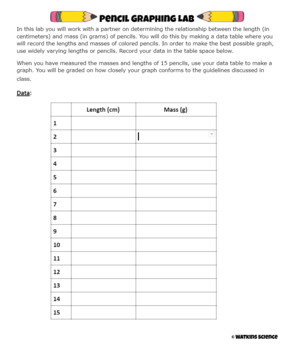
Pencil Graphing Lab
After teaching measurements and/or graphing, students need to practice their skills! This simple lab has students investigate the relationship between pencil length and mass. It can be modified to work for pencils, colored pencils, or crayons so set up is very teacher and cost-friendly. After collecting data, students create a graph and answer discussion questions about variables and the utility of graphs in drawing conclusions.
Grades:
4th - 12th
Types:

Tootsie Pop Lab Experiment
Watch an old Tootsie Pop commercial and discover how many licks it takes to get to the center of a Tootsie Pop. (Tootsie Pops not included). Students will be able to use the scientific method to observe, create a hypothesis, find variables, collect data, and come to a conclusion. Then, collect data from the class! In the packet, students can record peer's results to be able to create a bar graph with their findings.
Subjects:
Grades:
5th - 9th
Types:
CCSS:

Video Game Experiment
A video game experiment to help (re)introduce your students to the scientific method and writing an experiment about it. Use video games to help students understand the scientific method by experimentation. They will conduct an experiment where they play video games with different independent variables, record their results, create a graph, and write a conclusion. Links to free video games are included in the document.
Subjects:
Grades:
4th - 9th
Types:
Showing 1-10 of 10 results


