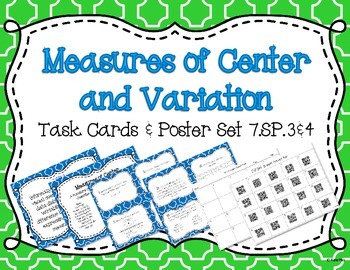
Measures of Center and Variation *Aligned to CCSS 7.SP3 & 7.SP.4
Katie May
805 Followers
Grade Levels
6th - 8th
Subjects
Resource Type
Standards
CCSS7.SP.B.3
CCSS7.SP.B.4
Formats Included
- PDF
Katie May
805 Followers
Also included in
- Provide your class with anchor charts, standards posters and task cards for every 7th Grade Statistics and Probability standard. The task card activities are great for individual, small group, or whole group instruction and review. Questions about drawing inferences from random samples, measures ofPrice $18.00Original Price $20.00Save $2.00
Description
Get your students engaged with this set of 20 task cards! The set is aligned with common core standard 7.SP.3&4 which can be easily printed using the standard poster. Students can use the 2 content posters to help them determine how to identify and solve measures of center and variation using different strategies when solving the 20 task cards.
Task Cards are a great way to incorporate collaborative learning (partners, peer tutors, etc) and assess learning. After students complete the activity, allow students to check their own answers and then share whole group common misconceptions or errors. This will continue to place the focus on learning in your classroom.
You can use these task cards two different ways. The first way is the traditional task cards, in which you can use as a whole group, station, review or remediation. The other way is geared to the 21st century learner~QR Codes. There are two student response pages and two answer sheets (traditional and 21st Century). This provides immediate feedback for the students to correct their mistakes.
My students LOVE solving these task cards because they are geared for the 21st century, using QR codes for the problems
----------------------------------------------------------------------------------------------
*****Get credit for future purchases:*****
Please go to your "My Purchases" page (you may need to login). Beside each purchase you'll see a "Provide Feedback" button. Simply click it and you will be taken to a page where you can give a quick rating and leave a short comment for the product. I value your feedback greatly as it helps me determine which products are most valuable for your classroom so I can create more for you. Also, each time you give feedback, TPT gives you credits that you use to lower the cost of your future purchases!
*****Become a follower: *****
Be the first to know about my new discounts, freebies, and product launches. Look for the green star near the top of any page within my store and click it to become a follower.
Also follow me on social media to more about my products and classroom!
Total Pages
Answer Key
N/A
Teaching Duration
N/A
Last updated Jun 28th, 2015
Report this resource to TPT
Reported resources will be reviewed by our team. Report this resource to let us know if this resource violates TPT’s content guidelines.
Standards
to see state-specific standards (only available in the US).
CCSS7.SP.B.3
Informally assess the degree of visual overlap of two numerical data distributions with similar variabilities, measuring the difference between the centers by expressing it as a multiple of a measure of variability. For example, the mean height of players on the basketball team is 10 cm greater than the mean height of players on the soccer team, about twice the variability (mean absolute deviation) on either team; on a dot plot, the separation between the two distributions of heights is noticeable.
CCSS7.SP.B.4
Use measures of center and measures of variability for numerical data from random samples to draw informal comparative inferences about two populations. For example, decide whether the words in a chapter of a seventh-grade science book are generally longer than the words in a chapter of a fourth-grade science book.


