TPT
Total:
$0.00

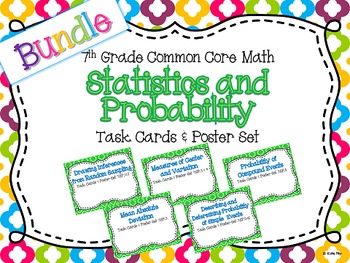
7th Grade Statistics and Probability Unit Resource Bundle

Rated 5 out of 5, based on 8 reviews
5.0 (8 ratings)
;
Katie May
805 Followers
Grade Levels
6th - 8th
Subjects
Resource Type
Standards
Formats Included
  • Zip
$18.00
List Price:
$20.00
You Save:
$2.00
Bundle
$18.00
List Price:
$20.00
You Save:
$2.00
Bundle
Share this resource
Report this resource to TPT
Katie May
805 Followers

Products in this Bundle (5)

    Description

    Provide your class with anchor charts, standards posters and task cards for every 7th Grade Statistics and Probability standard. The task card activities are great for individual, small group, or whole group instruction and review. Questions about drawing inferences from random samples, measures of center, measures of variation, mean absolute deviation, describing probability of simple events, determining probability of simple events, probability of compound events, and more. The questions range from simple to complex and are easy to differentiate for your students. Answer record sheets and answer keys (traditional and QR codes) are also provided.

    Statistics and Probability Bundle

    This bundle includes the following individual products that can be found in my store:

    **Drawing Inferences from Random Sampling Task Card and Poster Set

    **Measures of Center and Variation Task Card and Poster Set

    **Mean Absolute Deviation Task Card and Poster Set

    **Describing and Determining Probability of Simple Events Task Card and Poster Set

    **Probability of Compound Events Task Card and Poster Set

    Each task card and poster set includes the related common core standards posters and concept posters that explain and provide examples for each related concept.

    Buy the BUNDLE and Save!!

    Total Pages
    Answer Key
    N/A
    Teaching Duration
    N/A
    Last updated Sep 5th, 2015
    Report this resource to TPT
    Reported resources will be reviewed by our team. Report this resource to let us know if this resource violates TPT’s content guidelines.

    Standards

    to see state-specific standards (only available in the US).
    Understand that statistics can be used to gain information about a population by examining a sample of the population; generalizations about a population from a sample are valid only if the sample is representative of that population. Understand that random sampling tends to produce representative samples and support valid inferences.
    Use data from a random sample to draw inferences about a population with an unknown characteristic of interest. Generate multiple samples (or simulated samples) of the same size to gauge the variation in estimates or predictions. For example, estimate the mean word length in a book by randomly sampling words from the book; predict the winner of a school election based on randomly sampled survey data. Gauge how far off the estimate or prediction might be.
    Informally assess the degree of visual overlap of two numerical data distributions with similar variabilities, measuring the difference between the centers by expressing it as a multiple of a measure of variability. For example, the mean height of players on the basketball team is 10 cm greater than the mean height of players on the soccer team, about twice the variability (mean absolute deviation) on either team; on a dot plot, the separation between the two distributions of heights is noticeable.
    Use measures of center and measures of variability for numerical data from random samples to draw informal comparative inferences about two populations. For example, decide whether the words in a chapter of a seventh-grade science book are generally longer than the words in a chapter of a fourth-grade science book.
    Understand that the probability of a chance event is a number between 0 and 1 that expresses the likelihood of the event occurring. Larger numbers indicate greater likelihood. A probability near 0 indicates an unlikely event, a probability around 1/2 indicates an event that is neither unlikely nor likely, and a probability near 1 indicates a likely event.

    Reviews

    Questions & Answers

    805 Followers