TPT
Total:
$0.00

Linear Equations Functions Patterns Winter Snowflake Activity Print and Digital

Rated 4.74 out of 5, based on 27 reviews
4.7 (27 ratings)
;
8th Grade Math Teacher
3k Followers
Resource Type
Standards
Formats Included
  • PDF
  • Google Apps™
Pages
16 pages
$4.00
$4.00
Share this resource
Report this resource to TPT
8th Grade Math Teacher
3k Followers
Includes Google Apps™
The Teacher-Author indicated this resource includes assets from Google Workspace (e.g. docs, slides, etc.).

What educators are saying

We were learning how to determine pattern rules using models & scatter plots, and my students really got the hang of it!
The visual patterns and creation of a table really help students understand where the parts of the linear equation come from. All students of varying levels were able to complete atleast some parts of the activity.
Also included in
  1. This is a skill that CAN NOT be forgotten! Now you can practice linear functions in multiple representations all year round with this seasonal/ holiday bundle!These 11 ready-to-print activities are a fun way for students to relate patterns to linear functions and write linear equations in multiple r
    Price $27.00Original Price $44.50Save $17.50

Learning Objective

Students will use a pattern to write the equation of a linear function and represent it in a table and graph.

Description

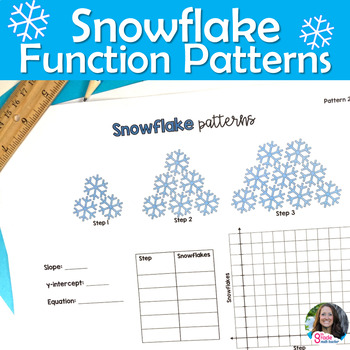
This winter activity is a fun way to introduce linear functions. Students relate visual patterns to the functions and write linear equations in multiple representations. This is the perfect activity to do during the holidays and winter.

There are 5 different sequences of snowflakes. Students are asked to

  • complete a table
  • graph the linear function
  • give the rate of change & initial value*
  • write the equation

*You can choose whether to ask students to identify the rate of change & initial value OR the slope & y-intercept.

For the PRINT version, print as a packet for each student or a set per group. There is room for students to draw what "step 0" would look like and students can circle or shade the snowflakes that represent the rate of change and slope in the pattern.

Students can use counters or snowflake erasers as manipulatives as they look for the changes in the patterns.

This is great as an introduction to constant rate of change and linear functions. It's also a useful resource for reviewing linear functions when you have a sub this winter or on a snow day. Or as just part of your Relations, Patterns, and Functions unit!

For the DIGITAL version, students fill in text boxes and use the line tool on Google Slides.

Love this activity? Check out the BUNDLE for year-round practice with functions!

You may also like...

Santa Hat Linear Functions Pattern Activity

Football Linear Functions Pattern Activity

Hearts (Valentine's Day) Linear Functions Pattern Activity

Christmas Slope Activity (Print & Digital)

Functions Posters Set for Word Wall

Functions Guided Notes/ Graphic Organizer BUNDLE

Rate of Change & Initial Value Worksheet

Functions Booklet Project

Slope-Intercept Form Game

Fall Functions Scavenger Hunt

Linear Functions Turkey Activity

Total Pages
16 pages
Answer Key
Included
Teaching Duration
40 minutes
Report this resource to TPT
Reported resources will be reviewed by our team. Report this resource to let us know if this resource violates TPT’s content guidelines.

Standards

to see state-specific standards (only available in the US).
Understand that a function is a rule that assigns to each input exactly one output. The graph of a function is the set of ordered pairs consisting of an input and the corresponding output.
Compare properties of two functions each represented in a different way (algebraically, graphically, numerically in tables, or by verbal descriptions). For example, given a linear function represented by a table of values and a linear function represented by an algebraic expression, determine which function has the greater rate of change.
Interpret the equation 𝘺 = 𝘮𝘹 + 𝘣 as defining a linear function, whose graph is a straight line; give examples of functions that are not linear. For example, the function 𝘈 = 𝑠² giving the area of a square as a function of its side length is not linear because its graph contains the points (1,1), (2,4) and (3,9), which are not on a straight line.
Construct a function to model a linear relationship between two quantities. Determine the rate of change and initial value of the function from a description of a relationship or from two (𝘹, 𝘺) values, including reading these from a table or from a graph. Interpret the rate of change and initial value of a linear function in terms of the situation it models, and in terms of its graph or a table of values.
Write arithmetic and geometric sequences both recursively and with an explicit formula, use them to model situations, and translate between the two forms.

Reviews

Questions & Answers