4 results
Common Core HSS-ID.A.4 resources for staff

FREE EDUCATIONAL WEBSITES LIST 4 ALL GRADES K-12 AND SUBJECTS + TEACHER RESOURCE
Sometimes, you just need a list of websites for everyone. Here it is. FREE EDUCATIONAL WEBSITES Put together by Teach Me, Maria!It takes time to gather this information, figure out the appropriate grade levels, and format, maintain, and update this page. All I ask is for an honest review if this list helps you.
Subjects:
Grades:
PreK - 12th, Staff
Types:

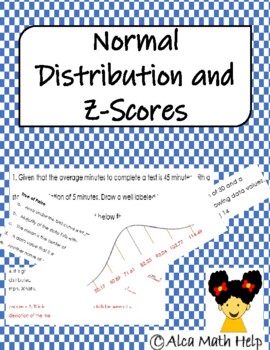
Normal Distibution and Z-Score- Statistics and AP Statistics
At the end of this activity students will be able to:•Calculate z-score and actual score/data value•Calculate standard deviation•Explain what is meant by unusual and or usual z-score•Create normal distribution curve (bell curve)•Use the 68-95-99.7 % rule to tell the regions of specific z-score •Answer sheet included!! This activity sheet can be used as a classwork, homework, pop quiz end of Unit Quiz.Marks should be personalized by teacher/users; also, students should be advised if they should s
Subjects:
Grades:
11th - 12th, Higher Education, Adult Education, Staff
Types:
CCSS:

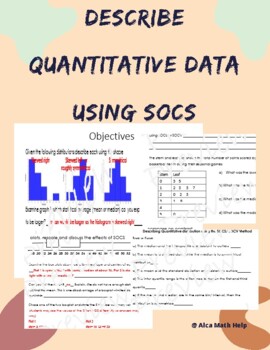
Describe Quantitative Data using SOCS/SOCV- Box plot, Histogram, Stem plot
If you are looking for a worksheet that can be used as a quiz, test, review packet you are at the right place. This activity sheet is suitable for students doing AP Stats and CP Probability and Statistics. This activity sheet allows students to:Use prior knowledge to answer true false questions and fill in the blanks with vocabulary provided.Describe box plots, histogram and stem plot using SOCS.Interpret the shape, center, outlier or any unusual feature along with the spread.
Subjects:
Grades:
11th - 12th, Higher Education, Adult Education, Staff
CCSS:

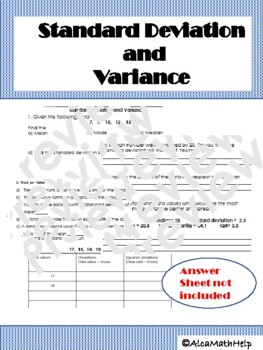
Standard Deviation and Variance AP Stats, CP probability and Statistics
If you are looking for an activity sheet that will help students to practice standard deviation and variance both by hand and the table. This is the activity you are looking for. Not too complex but requires some level of thinking.Objectives:1. Students should be able to interpret the relationship between the mean and standard deviation. 2. Students should know how the change in variables affects the spread and center. 3.Students will be able to complete a knowledge-based section by answering tr
Subjects:
Grades:
10th - 12th, Higher Education, Adult Education, Staff
CCSS:
Showing 1-4 of 4 results

