85 results
1st grade statistics internet activities for staff
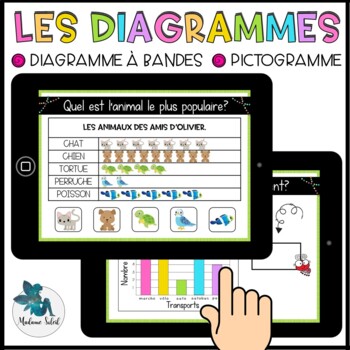
Les diagrammes au 1er cycle Boom Cards French distance learning
French pictograph, french graph. Activité mathématique de statistique permettant de travailler le diagramme, les diagrammes, le pictogramme, les graphiques, l'histogramme ou le diagramme à bande pour des élèves de 1re année, 2e année et 3e année. Super en groupe, en atelier, dans les centres mathématiques, à distance et à la maison. French immersion.Viens l'essayer avant de l'acheter !C'est quoi?20 Cartes Boom dans lesquelles les élèves doivent :- Analyser les diagrammes.- Répondre à la question
Subjects:
Grades:
1st - 3rd
Also included in: Bundle 1re année mai mathématique BOOM CARDS French distance learning
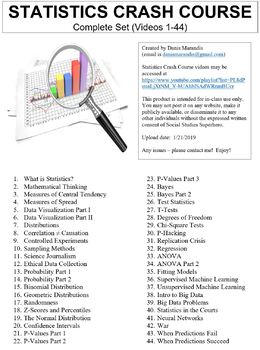
Crash Course Statistics Worksheets Complete Series Set Full Bundle Collection
This ZIP file contains Microsoft Word document worksheets (along with PDF versions) for each of the forty-four episodes of Crash Course Statistics hosted by Adriene Hill.Worksheets contain a combination of fill-in-the-blank and short answer questions. Each worksheet is accompanied with an answer key and relevant images.By purchasing this file, you agree not to make it publicly available (on external websites, etc.) or to share with any other teachers. It is intended for classroom use only. You *
Subjects:
Grades:
9th - 12th, Higher Education, Adult Education, Staff
Types:
Mathematics| Probability| Boom Cards| Digital Task Activity
Enhance your probability unit with our engaging DIGITAL TASK CARDS, designed to challenge students' critical thinking skills while making learning about likelihood a fun and rewarding experience.Probability Puzzles: These task cards present students with a series of intriguing scenarios, prompting them to determine the likelihood of each situation. Are the chances certain, likely, unlikely, or impossible? This activity encourages students to develop their probability skills while having a blast.
Subjects:
Grades:
K - 1st
Types:
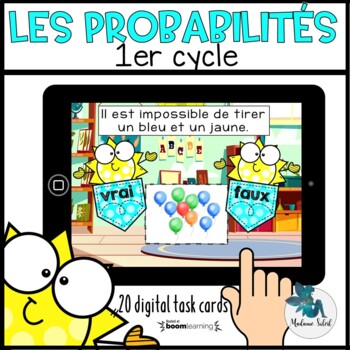
Les probabilités en 1re et 2e année Boom Cards French distance learning
French probability. Activité mathématique pour travailler les probabilités. Le vocabulaire mathématique suivant sera travaillé : possible, certain et impossible à travers des beignes, des ballons ou des dés.Super en grand groupe, en petit groupe, pour le tableau blanc, dans les centres mathématiques, en orthopédagogie, à distance et à la maison.Viens l'essayer avant de l'acheter !C'est quoi?20 Cartes Boom dans lesquelles les élèves doivent :- Déterminer si l'énoncé est vrai ou faux.- Appuyer sur
Subjects:
Grades:
1st - 2nd
Also included in: Bundle 1re année mars mathématique BOOM CARDS French distance learning
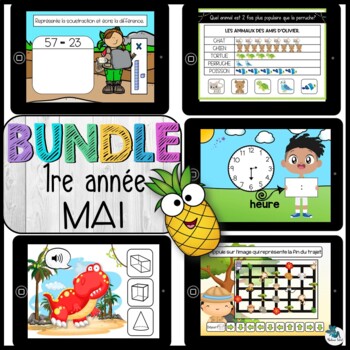
Bundle 1re année mai mathématique BOOM CARDS French distance learning
Bundle de Boom Cards 1re année mathématique de mai sur l'addition de nombres à 2 chiffres avec manipulation, la soustraction sans emprunt, les diagrammes, les pictogrammes, la statistique. lire l'heure, le temps, le trajet ou l'orientation spatiale, les solides, les faces planes et les face courbes, la géométrie pour les élèves de 1re année et de 2e année. Super en atelier, en centre mathématique, à distance ou à la maison. Un total de 100 cartes BoomVoici les 5 tableaux :- Addition et soustract
Subjects:
Grades:
1st - 2nd
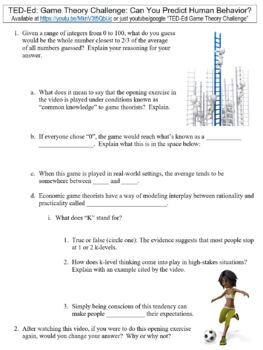
TED-Ed worksheet: Game Theory Challenge: Can You Predict Human Behavior?
This is a zip file that contains a Microsoft Word worksheet (along with a PDF version) to accompany the TED-Ed video for "Game Theory Challenge: Can You Predict Human Behavior?". Answer key is included as well.By purchasing this file, you agree not to distribute it to other non-students. It is intended for classroom use only, but may be used for distance learning as well as long as it is not made available outside of your students.=====Interested in Crash Course worksheet bundles?ALL Crash Cour
Subjects:
Grades:
9th - 12th, Higher Education, Adult Education, Staff
Types:
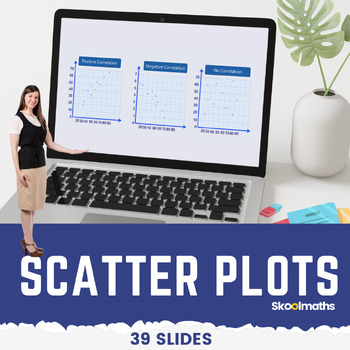
Eight Grade Scatter Plots Digital Math Lesson and Activities CCSS 8.SP.A.1
Eight Grade Scatter Plots Digital Math Lesson and ActivitiesTeach your high school grade how to use and interpret scatter graphs; recognize correlation; draw and use lines of best fit to make predictions?In this lesson, learners will be able to:use and interpret scatter graphs of bivariate data;recognize different types of correlation;draw estimated lines of best fit; anduse lines of best fit to make predictions.
Subjects:
Grades:
8th - 10th, Staff
Types:
CCSS:
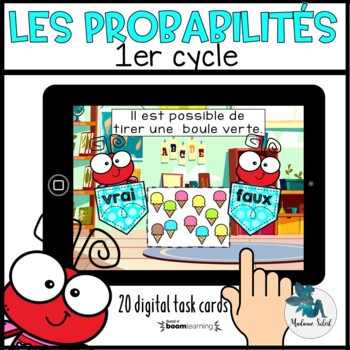
Les probabilités en 1re et 2e année Boom Cards French distance learning
French probability. Activité mathématique pour travailler les probabilités. Le vocabulaire mathématique suivant sera travaillé : possible, certain et impossible à travers des glaces, des crèmes glacées ou des dés.Super en atelier de math, pour le tableau blanc, dans les centres mathématiques, en orthopédagogie, à distance et à la maison.Viens l'essayer avant de l'acheter !C'est quoi?20 Cartes Boom dans lesquelles les élèves doivent :- Déterminer si l'énoncé est vrai ou faux.- Appuyer sur le bon
Subjects:
Grades:
1st - 2nd
Also included in: Bundle 2e année mai mathématique
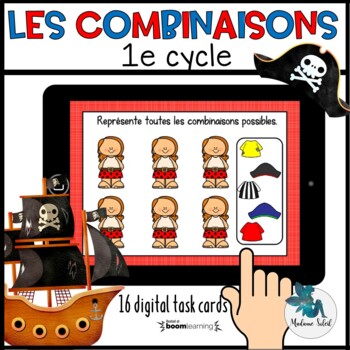
Les combinaisons chez les pirates Boom Cards French distance learning
Activité mathématique permettant de travailler sur le hasard (possibilités) et les combinaisons possibles sous le thème des pirates. Cette activité ne permet pas d'être autocorrigé. Une supervision adulte est nécessaire pour vérifier la compréhension de l'élève.Super en grand groupe, en petit groupe, pour le tableau blanc, dans les centres mathématiques, en orthopédagogie, à distance et à la maison.Viens l'essayer avant de l'acheter !C'est quoi?16 Cartes Boom dans lesquelles les élèves doivent
Subjects:
Grades:
1st - 3rd
Also included in: Bundle 1re année mars mathématique BOOM CARDS French distance learning
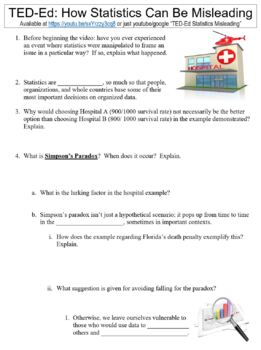
TED-Ed worksheet: How Statistics Can Be Misleading
This is a zip file that contains a Microsoft Word worksheet (along with a PDF version) to accompany the TED-Ed video for "How Statistics Can Be Misleading". Answer key is included as well.By purchasing this file, you agree not to distribute it to other non-students. It is intended for classroom use only, but may be used for distance learning as well as long as it is not made available outside of your students.=====Interested in Crash Course worksheet bundles?ALL Crash Course Videos (1400+ Works
Subjects:
Grades:
9th - 12th, Higher Education, Adult Education, Staff
Types:
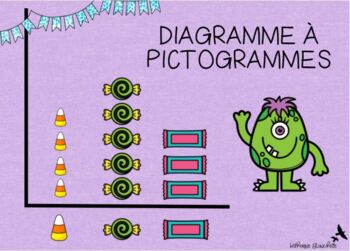
Le diagramme à pictogrammes
Activité de 14 cartes permettant aux élèves de travailler l'interprétation du diagramme à pictogrammes et aussi le classement dans celui-ci. Les cartes se présenteront de façon aléatoire d'une fois à l'autre. Consignes audio.Pour les utilisateurs de PREST 1, c'est en lien avec le thème 2, parcours 5.Pour utiliser les cartes Boom, vous devez être connecté à Internet. Les cartes Boom sont compatibles avec les navigateurs modernes (Chrome, Safari, Firefox et Edge). Les applications sont disponible
Subjects:
Grades:
1st
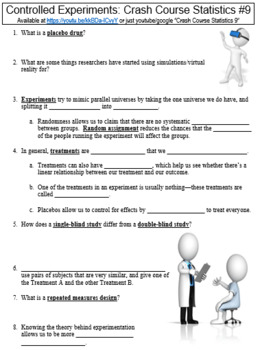
Crash Course Statistics #9 (Controlled Experiments) worksheet
This is a zip file that contains a Microsoft Word worksheet (along with a PDF version) to accompany the crash course video for Statistics #9. Answer key is included as well.By purchasing this file, you agree not to make it publicly available (on websites, etc.) or to share with any other teachers. It is intended for classroom use only. You may, however, post it on learning management systems such as Google Classroom as long as the file is only accessible to students and not to any outside source
Subjects:
Grades:
9th - 12th, Higher Education, Adult Education, Staff
Types:
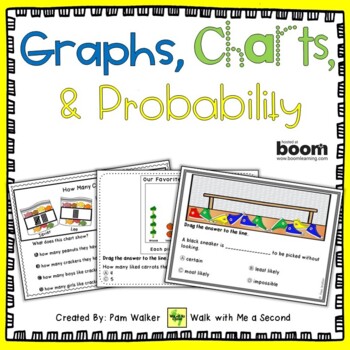
Graphing and Data with Boom Cards
This deck of 30 slides focuses on practice for the reading of charts, graphs, and data with six different presentations of data. This type of reading can be as challenging as text reading without practice.The click-to-answer plus drag-and-drop functions are easy to use for young learners. Like all Boom Cards, the answers are self-checking, so students get immediate feedback. The graph topics are engaging, too. Great for large or small groups, follow-up to lessons, distributive practice, independ
Subjects:
Grades:
1st - 3rd
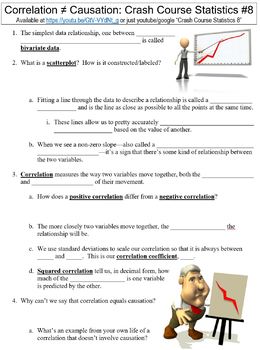
Crash Course Statistics #8 (Correlation ≠ Causation) worksheet
This is a zip file that contains a Microsoft Word worksheet (along with a PDF version) to accompany the crash course video for Statistics #8. Answer key is included as well.By purchasing this file, you agree not to make it publicly available (on websites, etc.) or to share with any other teachers. It is intended for classroom use only. You may, however, post it on learning management systems such as Google Classroom as long as the file is only accessible to students and not to any outside source
Subjects:
Grades:
9th - 12th, Higher Education, Adult Education, Staff
Types:
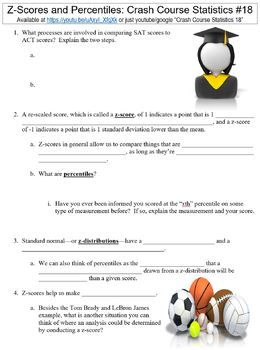
Crash Course Statistics #18 (Z-Scores and Percentiles) worksheet
This is a zip file that contains a Microsoft Word worksheet (along with a PDF version) to accompany the crash course video for Statistics #18. Answer key is included as well.By purchasing this file, you agree not to make it publicly available (on websites, etc.) or to share with any other teachers. It is intended for classroom use only. You may, however, post it on learning management systems such as Google Classroom as long as the file is only accessible to students and not to any outside sourc
Subjects:
Grades:
9th - 12th, Higher Education, Adult Education, Staff
Types:
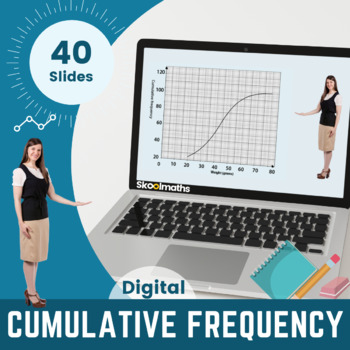
Cumulative Frequency - Digital Lesson and Activities for 9th-10th Grade
In this lesson, learners will be able to:1) construct and interpret cumulative frequency graphs, 2) interpret, analyze and compare the distributions of data sets through quartiles and inter-quartile range The lesson can be used as whole class teaching by teachers and at home by learners.Lots of drag and drop activities with instant feedback. Contains 40 interactive pagesTo open this lesson you need to unzip or extract the files.Choose index.html to view onlineThis lesson can also be viewed offl
Subjects:
Grades:
9th - 10th, Higher Education, Staff
Also included in: Complete Statistics and Probability Bundle | Digital and Print
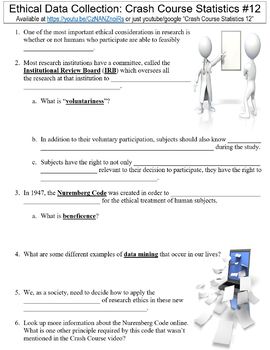
Crash Course Statistics #12 (Ethical Data Collection) worksheet
This is a zip file that contains a Microsoft Word worksheet (along with a PDF version) to accompany the crash course video for Statistics #12. Answer key is included as well.By purchasing this file, you agree not to make it publicly available (on websites, etc.) or to share with any other teachers. It is intended for classroom use only. You may, however, post it on learning management systems such as Google Classroom as long as the file is only accessible to students and not to any outside sourc
Subjects:
Grades:
9th - 12th, Higher Education, Adult Education, Staff
Types:
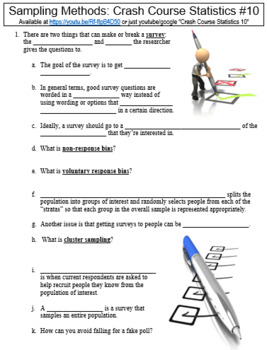
Crash Course Statistics #10 (Sampling Methods) worksheet
This is a zip file that contains a Microsoft Word worksheet (along with a PDF version) to accompany the crash course video for Statistics #10. Answer key is included as well.By purchasing this file, you agree not to make it publicly available (on websites, etc.) or to share with any other teachers. It is intended for classroom use only. You may, however, post it on learning management systems such as Google Classroom as long as the file is only accessible to students and not to any outside sourc
Subjects:
Grades:
9th - 12th, Higher Education, Adult Education, Staff
Types:

Content Marketing 101
This e-book has been written for information purposes only. Every effort has been made to make this ebook as complete and accurate as possible. However, there may be mistakes in typography or content. Also, this ebook provides information only up to the publishing date. Therefore, this ebook should be used as a guide - not as the ultimate source.
Subjects:
Grades:
Adult Education, Staff
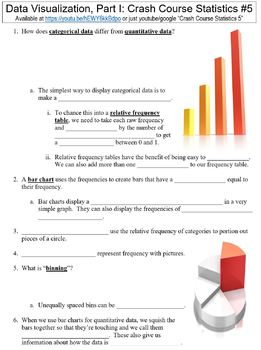
Crash Course Statistics #5 (Data Visualization, Part I) worksheet
This is a zip file that contains a Microsoft Word worksheet (along with a PDF version) to accompany the crash course video for Statistics #5. Answer key is included as well.By purchasing this file, you agree not to make it publicly available (on websites, etc.) or to share with any other teachers. It is intended for classroom use only. You may, however, post it on learning management systems such as Google Classroom as long as the file is only accessible to students and not to any outside source
Subjects:
Grades:
9th - 12th, Higher Education, Adult Education, Staff
Types:
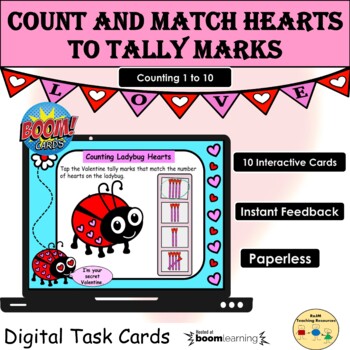
Valentine's Day Count 1 to 10 Hearts Tally Marks BOOM Cards™ Distance Learning
These 10 digital task cards on the BOOM Learning website relate to counting love hearts and matching the number counted to the correct tally marks. The counting is from 1 to 10. The cards are in random order and so this is a great way to review counting to 10 and working with tally marks which represent a number.To play this game: Count the number of hearts on the lovebugs and then click on the tally marks that matches the number of love hearts counted. If your answer is correct, you will see a
Subjects:
Grades:
PreK - 1st
Types:
Also included in: Valentines Day BOOM Cards™ Bundle Home and Distance Learning Task Cards
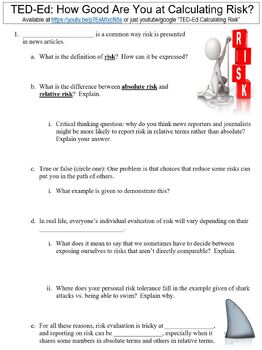
TED-Ed worksheet: How Good Are You at Calculating Risk?
This is a zip file that contains a Microsoft Word worksheet (along with a PDF version) to accompany the TED-Ed video for "How Good Are You at Calculating Risk?". Answer key is included as well.By purchasing this file, you agree not to distribute it to other non-students. It is intended for classroom use only, but may be used for distance learning as well as long as it is not made available outside of your students.=====Interested in a 125-worksheet bundle for Psychology TED-Ed videos?=====Inter
Subjects:
Grades:
9th - 12th, Higher Education, Adult Education, Staff
Types:
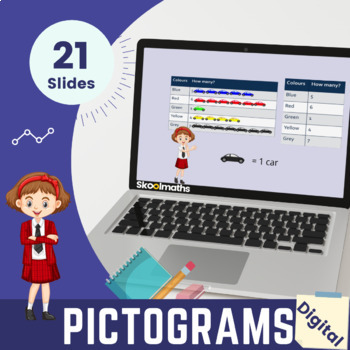
Picture Graphs | Represent and Interpret Data | 2nd Grade Activities
Want an engaging Graphing Unit activity that will teach your learners how to draw a picture graph? Buy this great value bundle of interactive lessons today to save you hours of planning and don't forget to leave an honest review if you download this worksheet for TPT credit :) In this lesson, learners will be able to:Draw a picture graph with a single-unit scale to represent a data set with up to four categories. Interpret and present data using pictograms and tables.Solve one-step and two-step
Subjects:
Grades:
1st - 3rd
Types:
Also included in: Handling Data - 2nd - 3rd Grade Bundle
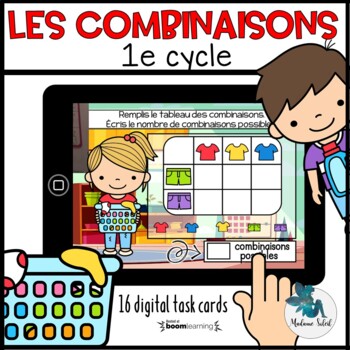
Les combinaisons possibles Boom Cards
Activité mathématique de Boom Cards permettant de travailler le hasard, les possibilités et les combinaisons possibles sous le thème des vêtements. Super en atelier de math, pour le tableau blanc, dans les centres mathématiques, en orthopédagogie, à distance et à la maison.Viens l'essayer avant de l'acheter !C'est quoi?16 Cartes Boom dans lesquelles les élèves doivent :- Déplacer les vêtements sur le tableau.- Respecter les combinaisons possibles.DescriptionC'est une activité auto-correctrice av
Subjects:
Grades:
1st - 2nd
Also included in: Bundle 2e année mai mathématique
Showing 1-24 of 85 results


