18 results
Spring Common Core 6.SP.B.5c resources
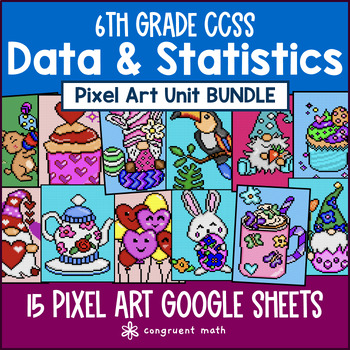
Data & Statistics Pixel Art Unit BUNDLE | 6th Grade CCSS
Students practice data & statistics including classifying statistical vs. non-statistical questions, classifying categorical vs. numerical data, identifying shapes of distribution, interpreting data in dot plots, histograms, stem-and-leaf plots, and box plots, measures of center (i.e. mean, median, mode), and measures of spread and variability (i.e. range, interquartile range, mean absolute deviations) with this 6th Grade CCSS Data and Statistics Pixel Art Unit Bundle. Contains 6 products wi
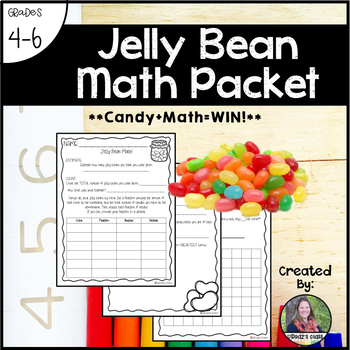
Jelly Bean Math Packet
When you combine candy with math, students are more engaged!
I love using candy to work on:
• Fractions
• Decimals
• Mean/Median/Mode/Range
• Graphing
• and MORE!
Give students a cup or mini-pack of jelly beans and watch them practice various math skills while having fun!
This could be done as a group with a larger amount, or individually. Individual students could complete the work and then get together with others to make comparison statements, analyze data, etc.
This packet is similar to

Data & Statistics Activity BUNDLE | 6th Grade Math | Digital & Print
This data and statistics bundle consists of 6 products (8 DIGITAL Pixel Art Google Sheets + 3 PRINT doodle math worksheet) that will help students practice calculating mean, median, mode, range, interquartile range as well as construct and interpret dot plots, histograms, stem and leaf plots, and box and whisker plots.All activities are great as sub plan, review lesson, extra credit, extensions, or independent practice! What's included?Product #1-3 (Digital Pixel Art Activities - 8 Google Sheet
Subjects:
Grades:
6th - 7th
Types:
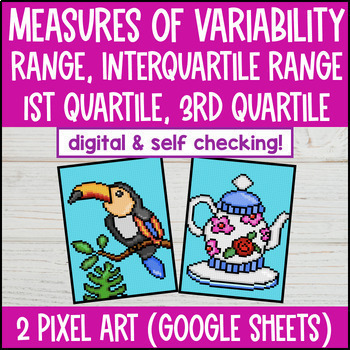
Interquartile Range Digital Pixel Art Activity | Measures of Variability
Take measures of variability practice to the next level with pixel art! Students practice finding range, first quartile (Q1), third quartile (Q3), and interquartile range (IQR) across 2 pixel art activities with 24 problems total. It's a perfect addition to your data & statistics unit.These self-checking Google Sheets give students instant feedback. Incorrect answers are highlighted in red, and correct answers turn green and unlock parts of a mystery picture. They’re easy to assign, keep stu
Subjects:
Grades:
6th - 7th
NO PREP ⭐ 6th Grade Spring Math Escape Room ⭐ Virtual, Digital, or Print
Digital Escape Room, 6th Grade Spring Math Escape Room: This no-prep math escape room is a fantastic way to review 6.SP.1, 6.SP.2, 6.SP.3, 6.SP.4, and 6.SP.5 in 6th grade! Students love working together to solve the clues in this escape activity.The escape room is digitally controlled and is perfect for laptops, desktops, iPads, Chromebooks, and tablets of all brands and operating systems! No add-ons, extensions, or extra preparation is required: only the internet browser included on your device
Subjects:
Grades:
5th - 7th
Types:
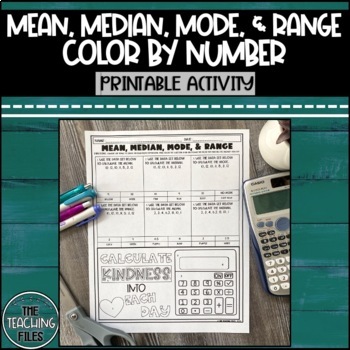
Mean Median Mode Range Color By Number | 6th Grade Statistics
This Mean, Median, Mode, and Range Color By Number activity allows students to practice calculating the mean, median, mode, and range of a data set. There are 6 problems involved for practice. This activity is aligned to 6th-grade math common core standards and comes with an answer key.About This Product:-PDF printable-6 problems included (2 data sets)-Non-editable-"Calculate kindness into each day" message with calculatorRelated Products:Exponents Interactive Matching ActivityAbsolute Value Act
Subjects:
Grades:
6th
Types:
Also included in: 6th Grade Math Statistics Bundle | CCSS Aligned
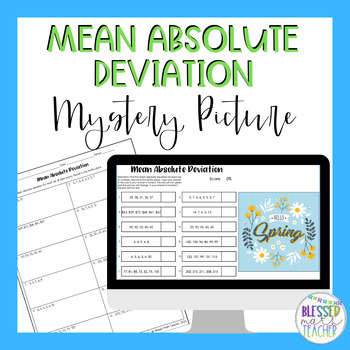
Mean Absolute Deviation Digital Activity Mystery Picture and Worksheet
This Google Sheets, self-checking digital activity has students calculate mean absolute deviation from 12 different data sets. After all the questions are answered correctly, a new picture is revealed! A worksheet is included for students to show work + answer key!Included in PDF form:▪️ Google Sheets link - Mystery Picture Activity▪️ Printable Worksheet▪️ Answer KeyThis activity aligns with TEKS 8.11B.Other Resources You Might Like:▪️ Pythagorean Theorem Digital Activity▪️ Transformations - Ref
Subjects:
Grades:
7th - 8th
Types:
CCSS:
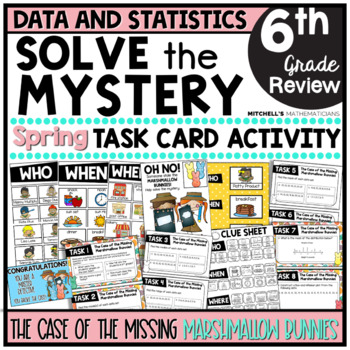
6th Grade Data and Statistics Solve The Mystery Spring Task Cards
I am excited to share this Spring Themed MYSTERY CHALLENGE activity with you and your students! You will begin this task card activity by reading a short story that will challenge your students to solve the case of the missing marshmallow bunnies. They will have to find out who took them, when they took them, and where they put them. To solve the case, students will work to complete 9 different task cards. The task cards are based on the 6th grade statistics and probability standards. Once they
Subjects:
Grades:
6th
Types:
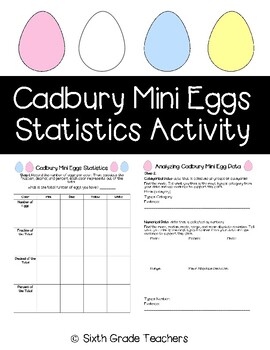
Cadbury Mini Eggs Statistics Activity
The Cadbury Mini Eggs Statistics Activity is a fun and festive way to celebrate Easter or spring while practicing math skills. Students will receive a pack of Cadbury Mini Eggs or a certain amount if you purchase bags. Students will record the number of eggs per color, and then identify the fraction, decimal, and percent each color represents of the total. Students will then analyze the data by finding the mean, median, mode, range, and mean absolute deviation. Students will create a Pictograph
Subjects:
Grades:
5th - 8th
Types:
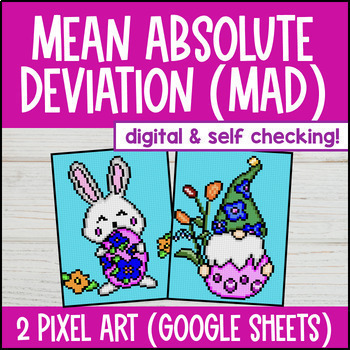
Mean Absolute Deviation Digital Pixel Art | Measures of Variability and Spread
Take measures of variability and mean absolute deviation practice to the next level with pixel art! Students practice finding the mean and mean absolute deviation of differently-sized datasets across 2 pixel art activities with 24 problems total. It's a perfect addition to your data & statistics unit.These self-checking Google Sheets give students instant feedback. Incorrect answers are highlighted in red, and correct answers turn green and unlock parts of a mystery picture. They’re easy to
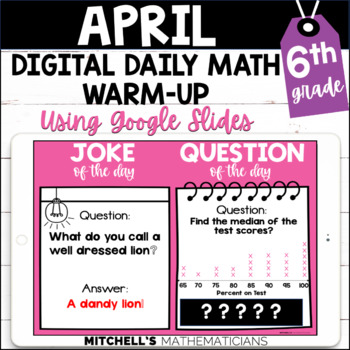
6th Grade Digital Daily Math Warm-Up for April
Are you looking for activities to use digitally with your students? These math warm-up slides are a fun way to start your day with your students from home. These will give students an engaging way to begin your Zoom or Google Meet. You will receive 25 different slides for April. Each slide will have a joke and a question of the day. Each slide is ready for you to make a digital copy and send. I will be sending these daily to my students through Google Classroom as well as going over them in Go
Subjects:
Grades:
6th
Types:
Also included in: 6th Grade Digital Daily Math Warm-Up FULL YEAR BUNDLE
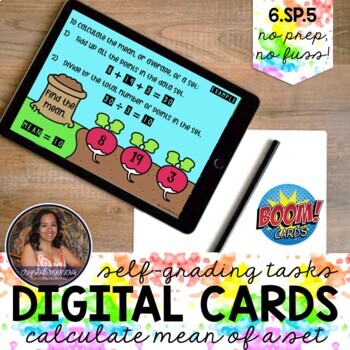
6SP5 Finding the Mean of a Data Set Boom Cards™ | Digital Math Tasks
This 6SP5 Boom Cards deck to find the average of a set is NO PREP, NO FUSS! Includes a worked-through example for guidance. Students will select from multiple choice. Digital self-checking cards make this deck GREAT for independent use during distance learning!TECHNOLOGY REQUIREMENTS: To use Boom Cards, you must be connected to the Internet. Boom Cards play on modern browsers (Chrome, Safari, Firefox, and Edge). Apps are available for Android, iPads, iPhones, and Kindle Fires. YOUR BOOM LEARNING
Subjects:
Grades:
5th - 8th
Types:
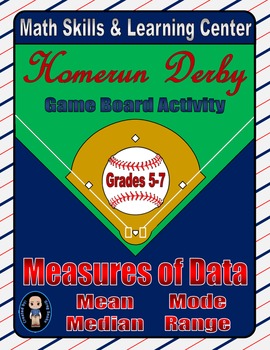
Baseball Math Skills & Learning Center (Measures of Data)
Are you ready to bring the fun and excitement of a homerun derby into your classroom? Or would your students prefer to play a head-to-head game of baseball? If so, here are two enjoyable baseball games for your students to practice the skill of calculating the mean, median, mode, and range. Just print and play!
Three different sets of recording sheets and game cards are included on this file. I prefer to use the first set as an introductory, whole-class activity, and then use the second and thi
Subjects:
Grades:
5th - 7th
The Editable Spring Spirit QR Code Activity- Distance Learning
The Spring Spirit QR Code Activity is the perfect way to engage students with learning, technology, group/ independent work, and a mini room transformation for spring should you choose to decorate. This activity allows students to practice calculating statistical measures and analyzing displays with 15 practice problems.**It now includes an editable version that is also digital. You can use this for any subject to review any content/material. Please note, the font and clipart are different in th
Subjects:
Grades:
5th - 7th
Types:
Also included in: The Holiday QR Code Activity Bundle
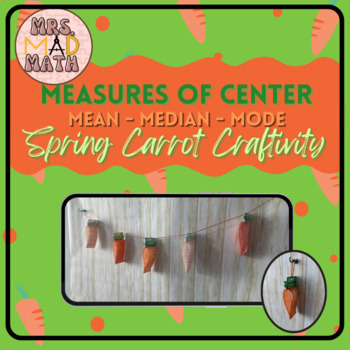
Spring/Easter Measures of Center Mean Median Mode Math Carrot Craftivity
Celebrate the spring season and make practicing measures of center fun with this 3-D carrot craftivity. Students will practice finding the mean, median, and mode of different data sets. Six different versions give you the option to assign one or multiple carrots per student. After determining the measures of center, students will cut, color, and assemble their 3-D carrots for display around the classroom. Should I really use coloring and craftivities in my upper elementary/middle school math cla
Grades:
5th - 7th
Types:
Spring Statistics Project
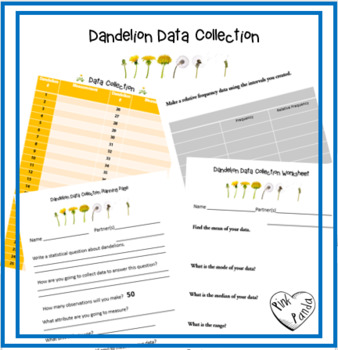
This is a fun activity for students to get outside and apply the standards in the Statistics Unit. Students will get the opportunity to get outside to gather statistics on dandelions, which are in abundance on school grounds this time of year. This project can easily be integrated with a non-fiction reading about dandelions, some fun dandelion crafts, or science discovery of the plant cycle. I use this activity as a summative assessment for our statistics chapter. 6.SP.A.1, 6.SP.B.5a, 6.SP.B
Subjects:
Grades:
6th - 7th
Spring Maze: Calculating Mean & Median (Measures On Center)
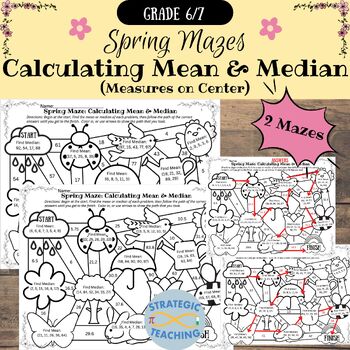
This Product Includes:1 maze- Finding mean and median no decimals in the answer (pdf)1 maze-Finding mean and median with decimals in the answer (pdf)2 answer sheets (pdf)Product Information:This product was designed as a supplemental activity to help students practice calculating mean and median.This product comes with 2 mazes that can be used to differentiate instruction.Maze 1: Finding mean and median no decimals in the answersMaze 2: Finding mean and median with decimals in the answersThis ca
Subjects:
Grades:
6th - 7th
Types:
CCSS:
Also included in: 6th Grade Math Computation: Seasonal Maze BUNDLE
Baseball (Homerun Derby) Game Cards (Measures of Data) Sets 4-5-6
This file contains three additional sets of game cards and recording sheets for my Baseball-themed Math Skills & Learning Center Measures of Data. These additional 96 problems go with your Homerun Derby game board, and will continue the fun and excitement in your classroom well into the season!
Items within this file:
●3 calculating the mean & median recording sheets with corresponding answer keys for the students to record their answers to the various questions they will solve during
Subjects:
Grades:
5th - 7th
Showing 1-18 of 18 results


