11 results
Earth sciences Common Core 6.SP.A.3 resources
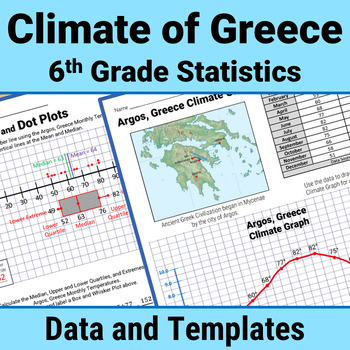
Greece Geography 6th Grade Statistics Box Plot Histogram Mean Median Activity
Enrich your study of Ancient Greece using 6th Grade stats skills to analyze Greek climate data. Calculate Measures of Central Tendency (mean, median, mode, range) and Mean Absolute Deviation. Master Data Display with Box and Whisker Plots, Histograms, Dot Plots, Stem and Leaf Charts. Write Statistical Questions. Analyze Data Distribution and Data Variability.All with climate data (temperature and precipitation) from Greece!This Print and Go STEM/STEAM PBL resource includes 70+ pages of climate d
Subjects:
Grades:
6th - 8th
NGSS:
MS-ESS2-6
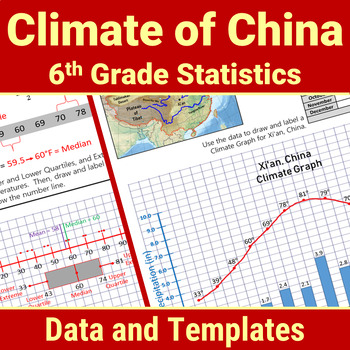
China Geography 6th Grade Statistics Box Plot Histogram Mean Median Activity
Enrich your study of Ancient China using 6th Grade statistics and Probability skills to analyze China climate data. Calculate Measures of Central Tendency (mean, median, mode, range) and Mean Absolute Deviation. Master Data Display with Box and Whisker Plots, Histograms, Dot Plots, Stem and Leaf Charts. Write Statistical Questions. Analyze Data Distribution and Data Variability.All with climate data (temperature and precipitation) from China!This Print and Go STEM/STEAM PBL resource includes 70
Subjects:
Grades:
6th - 8th
NGSS:
MS-ESS2-6
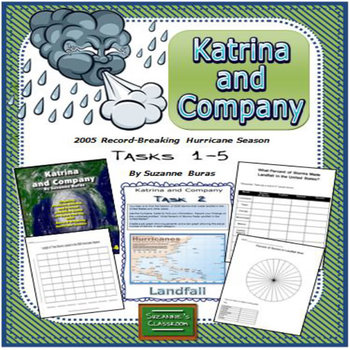
Hurricanes, Fractions to Percents, Statistics, Graphing: Katrina & Co. Tasks 1-5
These statistic tasks related to hurricanes are perfect for math centers, individual or partner work. Katrina and Company, Tasks 1-5, consists of 5 activities dealing with analyzing data related to the 2005 Record-Breaking Hurricane Season of 27 named storms. Students use charts to record information on 4 questions: (1) What percent of storms were in each category? (2) What percent of storms made landfall in the U.S.? (3) What percent of storms lasted the longest? and (4) What percent of storms
Subjects:
Grades:
4th - 7th
Types:
Also included in: Graphing and Analyzing Data: Katrina and Company: Bundle
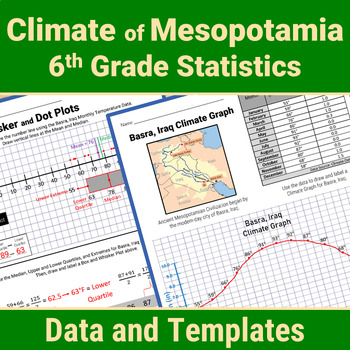
Mesopotamia Geography 6th Grade Statistics Box Plot Mean Median Mode Activity
Enrich your study of Mesopotamia using 6th Grade stats skills to analyze Mesopotamian climate data. Calculate Measures of Central Tendency (mean, median, mode, range) and Mean Absolute Deviation. Master Data Display with Box and Whisker Plots, Histograms, Dot Plots, Stem and Leaf Charts. Write Statistical Questions. Analyze Data Distribution and Data Variability.All with climate data (temperature and precipitation) from Iraq and Turkey!This Print and Go STEM/STEAM resource includes 70+ pages of
Subjects:
Grades:
6th - 8th
NGSS:
MS-ESS2-6
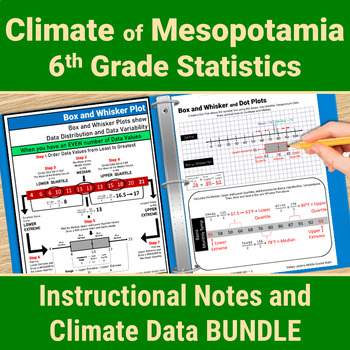
Mesopotamia Geography 6th Grade Statistics Mean Median Mode Box Plot Activity
Enrich your study of Mesopotamia using 6th Grade stats skills to analyze Mesopotamian climate data. Master Data Display with Box and Whisker Plots, Histograms, Dot Plots, Stem and Leaf Charts. Calculate Measures of Central Tendency (mean, median, mode, range) and Mean Absolute Deviation. Write Statistical Questions. Analyze Data Distribution and Data Variability.All with climate data (temperature and precipitation) from Iraq and Turkey!This Print and Go STEM/STEAM PBL resource includes 120 pages
Subjects:
Grades:
6th - 8th
NGSS:
MS-ESS2-6
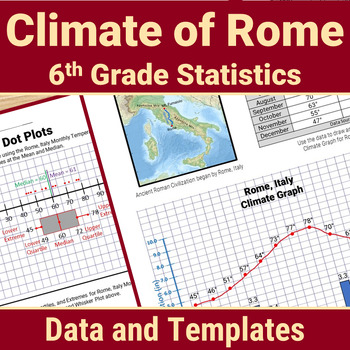
Rome Geography 6th Grade Statistics Box Plot Histogram Mean Median Mode Activity
Enrich your study of Ancient Rome using 6th Grade stats skills to analyze Italy climate data. Calculate Measures of Central Tendency (mean, median, mode, range) and Mean Absolute Deviation. Master Data Display with Box and Whisker Plots, Histograms, Dot Plots, Stem and Leaf Charts. Write Statistical Questions. Analyze Data Distribution and Data Variability.All with climate data (temperature and precipitation) from Rome!This Print and Go STEM/STEAM PBL resource includes 70+ pages of climate data
Subjects:
Grades:
6th - 8th
NGSS:
MS-LS2-1
, MS-ESS2-6
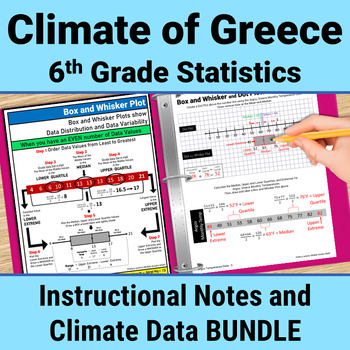
Greece Geography 6th Grade Statistics Mean Median Mode Range Box Plot Activity
Enrich your study of Ancient Greece using 6th Grade statistics skills to analyze Greek climate data. Master Data Display with Box and Whisker Plots, Histograms, Dot Plots, Stem and Leaf Charts. Calculate Measures of Central Tendency (mean, median, mode, range) and Mean Absolute Deviation. Write Statistical Questions. Analyze Data Distribution and Data Variability.All with climate data (temperature and precipitation) from Greece!This Print and Go STEM/STEAM PBL resource includes 120 pages of Inst
Subjects:
Grades:
6th - 8th
Types:
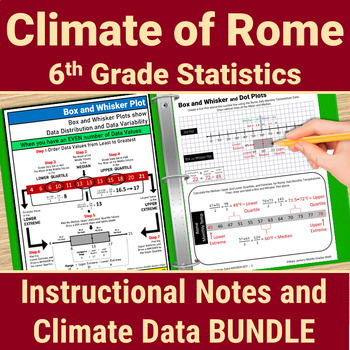
Rome Geography 6th Grade Statistics Mean Median Mode Box Plot Histogram Activity
Enrich your study of Ancient Rome using 6th Grade Statistics and Probability skills to analyze Italy climate data. Master Data Display with Box and Whisker Plots, Histograms, Dot Plots, Stem and Leaf Charts. Calculate Measures of Central Tendency (mean, median, mode, range) and Mean Absolute Deviation. Write Statistical Questions. Analyze Data Distribution and Data Variability.All with climate data (temperature and precipitation) from Rome!This Print and Go STEM/STEAM PBL resource includes 120 p
Subjects:
Grades:
6th - 8th
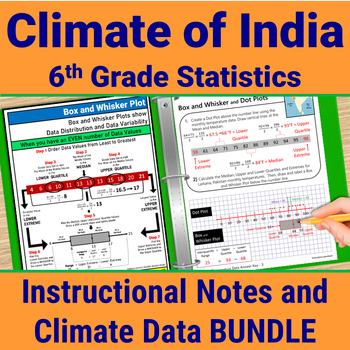
India Geography 6th Grade Statistics Mean Median Mode Range Box Plot Activity
Enrich your study of India using 6th Grade stats skills to analyze India climate data. Master Data Display with Box and Whisker Plots, Histograms, Dot Plots, Stem and Leaf Charts. Calculate Measures of Central Tendency (mean, median, mode, range) and Mean Absolute Deviation. Write Statistical Questions. Analyze Data Distribution and Data Variability.All with climate data (temperature and precipitation) from ancient Indian sites!This Print and Go STEM/STEAM PBL resource includes 120 pages of Inst
Subjects:
Grades:
6th - 8th
NGSS:
MS-ESS2-6
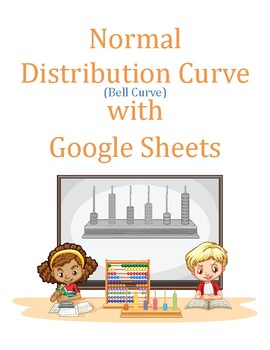
Normal Distribution - Bell Curve - with Google Sheets —Distance Learning
A normal distribution curve is better known as the Bell Curve. The information in the curve represents information that occurs naturally. This information is things like test scores or people’s height. A normal distribution curve is a statistical tool. It uses other statistical methods. These include Mean, Mode, and Median. Mean is another term for average. This exercise uses data from NOAA. The curve in the lesson represents the earthquake Magnitudes as collected by NOAA. NOAA is the National O
Subjects:
Grades:
4th - 12th
Types:
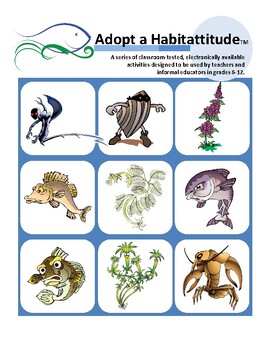
Adopt a Habitattitude
Adopt a Habitattitude(TM) is a series of classroom-tested, electronically available activities designed to be used by teachers and informal educators in grades 6-12. These innovative and engaging activities can help students learn about and prevent the spread of aquatic invasive species (AIS). In order to protect and sustain our water bodies for future generations, youth—our future decision makers and leaders—need to acquire relevant knowledge about AIS to become effective and responsible decisi
Subjects:
Grades:
6th - 12th
NGSS:
MS-LS1-5
, MS-LS2-2
, MS-LS2-3
, MS-LS2-5
, MS-LS2-4
...
Showing 1-11 of 11 results


