4 results
Common Core HSS-ID.A.3 resources for Gifted and Talented
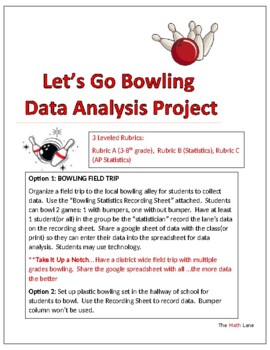
Let's Go Bowling Statistics STEM Project & Field Trip (3-12 and AP Stat)
Great END OF YEAR project. Get ready to strike up some fun with your students on a field trip to the bowling alley or right in your own hallway with a plastic bowling set! This isn't just any ordinary field trip - it's a real-world data collection extravaganza. 3 different leveled rubrics (Grade 4-10, Statistics, AP Statistics) so students can analyze the data based on their math knowledge. Students will be able to practice creating and analyzing graphical displays, scatterplots, construct c
Subjects:
Grades:
Not Grade Specific
Types:
Also included in: High School Statistics Project Bundle
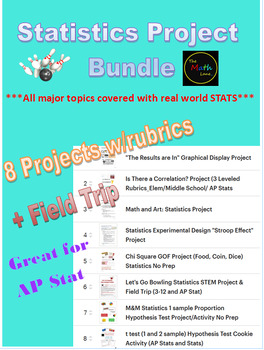
High School Statistics Project Bundle
Get ready to supercharge your statistics curriculum with these 8 dynamic projects designed to engage and challenge your students! From collecting and analyzing data using Google Forms and Sheets in 'The Results are In' to exploring correlations with scatterplots and LSRL in 'Is There a Correlation?', these projects will take your students on a statistical journey like never before. In 'Math and Art', students will combine their love for statistics with their creativity as they create a piece of
Subjects:
Grades:
9th - 12th
Types:
CCSS:
AP Statistics/Stats FULL Curriculum LINK (notes, wksts, PROJECTS) and Consultant
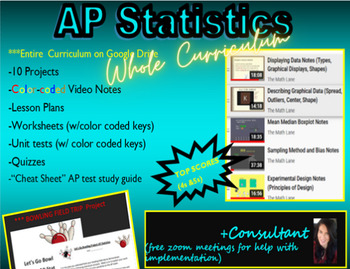
Get ready to supercharge your students' AP Statistics experience with this dynamic curriculum! With over 50% of students earning 4s or 5s on the AP exam, this program is proven to deliver top results. Featuring color-coded video notes, worksheets, activities, and 10 engaging projects, this curriculum is designed to keep students engaged and excited about statistics. Plus, with a Bowling Field Trip Project Opportunity included, students will have the chance to apply their knowledge in a real-worl
Subjects:
Grades:
10th - 12th
CCSS:
"The Results are In" Graphical Display Stats End of Year Project (All Grades)
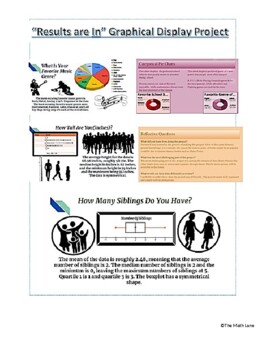
Get ready to take your data analysis skills to the next level with our Graphical Display Project! Designed for students who want to create visually stunning displays of their data, this project allows you to not only collect data using Google Surveys, but also analyze and present it using Google Sheets. With detailed instructions, project examples, and a comprehensive rubric included, you'll have everything you need to create professional-looking graphical displays of both numerical and categori
Subjects:
Grades:
Not Grade Specific
Types:
CCSS:
Also included in: High School Math Projects (Algebra II and Statistics) STEM No prep
Showing 1-4 of 4 results

