13 results
Not grade specific Common Core 6.SP.B.4 resources
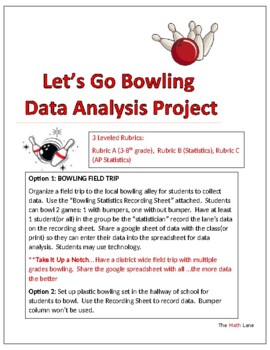
Let's Go Bowling Statistics STEM Project & Field Trip (3-12 and AP Stat)
Great END OF YEAR project. Get ready to strike up some fun with your students on a field trip to the bowling alley or right in your own hallway with a plastic bowling set! This isn't just any ordinary field trip - it's a real-world data collection extravaganza. 3 different leveled rubrics (Grade 4-10, Statistics, AP Statistics) so students can analyze the data based on their math knowledge. Students will be able to practice creating and analyzing graphical displays, scatterplots, construct c
Subjects:
Grades:
Not Grade Specific
Types:
Also included in: High School Statistics Project Bundle
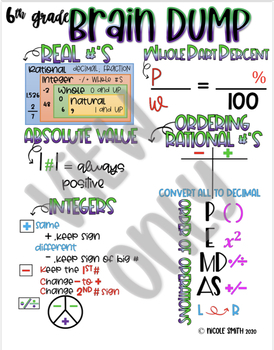
6th Grade Brain Dump
This is a summary of what my 6th graders had to learn by the end of the school year. It's a straight to the point brain dump of information and strategies they can easily use and remember. Suggestions: They would copy this while in stations, during bell-ringer, at home for homework, and even use a tutorial tool for past and current assignments. They didn't write everything at once towards the beginning. It was given as they learned the material, but it's up to you to decide that. (Based off my c
Subjects:
Grades:
6th - 12th, Not Grade Specific
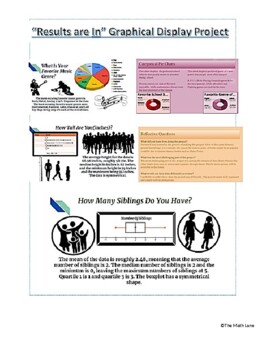
"The Results are In" Graphical Display Stats End of Year Project (All Grades)
Get ready to take your data analysis skills to the next level with our Graphical Display Project! Designed for students who want to create visually stunning displays of their data, this project allows you to not only collect data using Google Surveys, but also analyze and present it using Google Sheets. With detailed instructions, project examples, and a comprehensive rubric included, you'll have everything you need to create professional-looking graphical displays of both numerical and categori
Subjects:
Grades:
Not Grade Specific
Types:
CCSS:
Also included in: High School Math Projects (Algebra II and Statistics) STEM No prep
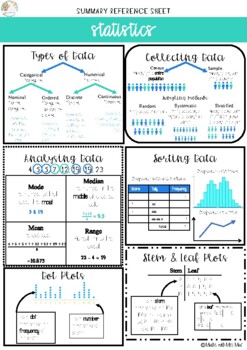
Summary Reference Sheet - Statistics
This product summarises key information when introducing statistics. Print and distribute to students to use as summary reference sheets while they work through the topic or display on your bulletin boards or classroom walls all year round. You and your students will find this simple yet informative cheat sheet easy to use!
Subjects:
Grades:
Not Grade Specific
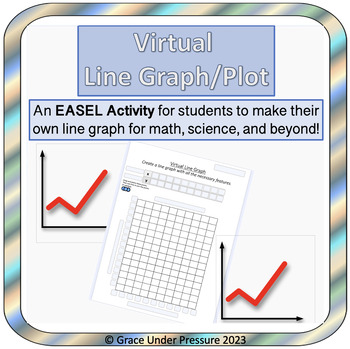
Virtual Line Graph or Scatter Plot Template: EASEL ONLY
This product is a virtual (EASEL) line graph or scatter plot template that can be used for graphing data from math, science, social studies, psychology, or other subjects.You can type in the ordered pairs ahead of time, or you can have your students type them into the (x,y) chart. Then, they have to use the ordered pairs to make a line graph or scatter plot:• Type in a title• Label x & y axis• Choose an appropriate scale and enter it on each axis• Drag and drop the circles as data points• Us
Subjects:
Grades:
Not Grade Specific
STEAM Through the Year: Mathematics – January Edition
STEAM Through the Year: Mathematics for January guides you through the month with STEAM lessons and projects. Students build mathematical proficiency with monthly-thematic lessons correlated to the National Council of Teachers of Mathematics standards. Here you will find easy-to-use lessons providing practical strategies and problem-solving activities. The math and poetry lessons are themed around January special days and holidays – New Year’s Day, Celebration of Life Month, International Thank
Subjects:
Grades:
1st - 6th, Not Grade Specific
Types:
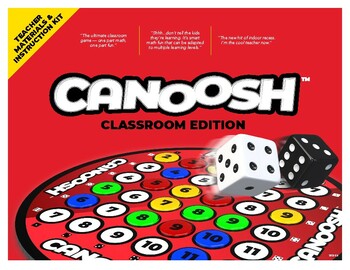
Canoosh Dice Probability Game — Complete (7 Games)
Canoosh is a collection of fast-action, easy-to-learn classroom dice games based on a simple two-dice probability chart. It was designed to be inclusive of any age/learning ability and integrates healthy competitive fun with a range of math learning concepts:Addition and subtractionFractionsProbability and statisticsStrategyCanoosh Classroom Edition is designed to be projected on a wall or chalkboard. You can use it with an entire class, divided into teams, in smaller group play, or as the new f
Subjects:
Grades:
Not Grade Specific
Types:
Super Bowl INTERACTIVE Bulletin Board
This is a mixture of resources where you can create a prediction of what team you think will win the super bowl. I have used this in the path to create bar graphs of who your class thinks is going to win the super bowl. We have done it at the level where we had multiple team predictions 2 NFC teams 2 AFC teams then we take away those teams at the end. I also have students write out their responses in a sentence or a mini paragraph explaining why they choose the team they choose. Each year I typi
Bar Graphs NC.6.SP.4 - Extended Curriculum (editable)
NC Extended Curriculum NC.6.SP.4This Google Slides presentation addresses the standard NC.6.SP.4. It was created as a test review to mirror the NC Extend I Test.There is 1 question per slide.I use this twice during the year:First, I use it as one of my many resources when teaching and assessing the standard. I like to print this 4 pages per sheet and fold the paper into quarters. This way the students are not overwhelmed with information and can only see one question at a time.I use this a secon
Subjects:
Grades:
Not Grade Specific
Types:
Also included in: 6th Grade Math - NC Extended Content - Test Prep and Assessments
Mean, Median, Mode, and Visualizing Real Data - Group Activities
These activities and handouts task groups of students to calculate the mean, median, mode, and range of real data, as well as plotting a box plot and a histogram, through 6 group activities that can take 1 to 3 hours, depending on the class. Solutions are provided where applicable (3 activities).Target Level of Math Class:Pre-algebra, arithmetic, introduction to statistics, data visualizationAccess to calculators.For completion in groups in person, with students actively sharing solutions with
Subjects:
Grades:
Not Grade Specific
Types:

Graphing Food Items
Google slide activity great for students with SID and/or CVI.
Subjects:
Grades:
Not Grade Specific
Types:
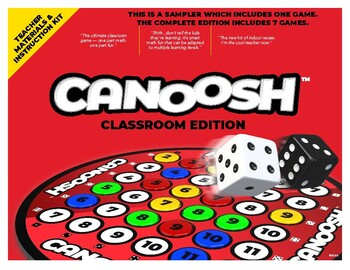
Canoosh Dice Probability Game (1-Game Sampler)
Canoosh is a collection of fast-action, easy-to-learn classroom dice games based on a simple two-dice probability chart. It was designed to be inclusive of any age/learning ability and integrates healthy competitive fun with a range of math learning concepts:Addition and subtractionFractionsProbability and statisticsStrategyCanoosh Classroom Edition is designed to be projected on a wall or chalkboard. You can use it with an entire class, divided into teams, in smaller group play, or as the new f
Subjects:
Grades:
Not Grade Specific
Types:
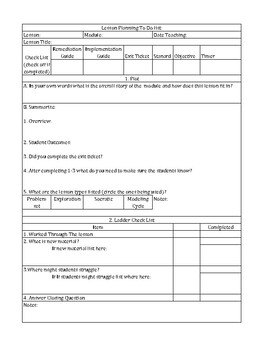
Eureka Math/Engage NY Lesson Plan Set Up and Reflection
Breaking down the lessons for Eureka Math or Engage NY can become daunting. With this CCSS aligned curriculum it is important that we stick to the lesson give with fidelity. However, this is not always easy to communicate on a lesson plan. I have take Eureka Materials and developed a lesson plan outline to help you create and implement your Eureka Math/Engage NY lesson plan.
Grades:
Not Grade Specific
Showing 1-13 of 13 results

