6 results
Graphing Common Core W.6.1b resources
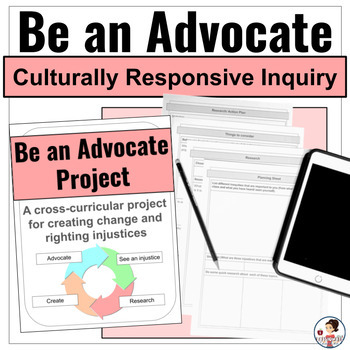
Cultural Awareness & Social Justice Project: Project Based Learning Inquiry
Culturally responsive teaching, social justice, and equity inquiry projects, student voice and choice, identity work... Are these ideas that you are trying to implement in your grades 5, 6, or 7 classrooms, but don't know where to begin? Don't worry passionate teacher, I have got you covered! I call it our advocate project (which is a passion project but WAY deeper) and it is exactly what you need to bring your student's identities and passions into the classroom while teaching them to speak up
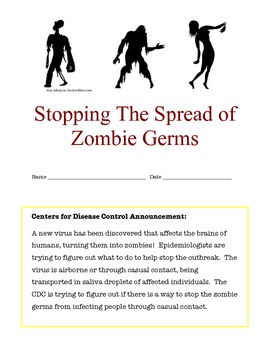
Preventing The Spread of Zombie Germs!
Students in grades 5 through 8 can actually measure the effectiveness of hand washing in a scientifically controlled way. Students identify variables, complete data tables, graph results and analyze their data. Teachers will need access to a black light and a small drop of glow in the dark paint. Kids really enjoy this activity and it utilizes many Common Core skills.
Subjects:
Grades:
5th - 8th
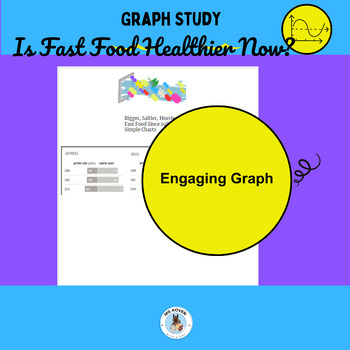
Analyzing Graphs: Is Fast Food Healthier Now, Story Problems, Middle School
Uncover the transformation of fast food through engaging graph study and story problems. Students will explore real-world data since 1986, applying mathematical concepts to analyze trends in fast food evolution. It comes with a creative story prompt, focusing on mathematical processes involving whole numbers, decimals, fractions, or percents. Ready to assign!Product Description: Explore the evolution of fast food with our interactive graph study resource, highlighting the shifts in fast food cha
Subjects:
Grades:
6th - 8th
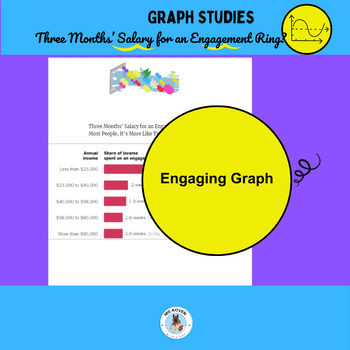
Analyzing Graphs: Engagement Ring Cost, Story Problems, Middle School
Delve into the intricacies of engagement ring costs with our interactive graph study and creative story problem task! This comprehensive learning module encourages students to compose meaningful story problems employing varied mathematical processes using real-world data on engagement ring expenditures. The package is complete with examples and a Pear Deck add-on and is ready to assign, offering a seamless, engaging learning experience to explore financial trends and consumer behavior in the rea
Grades:
6th - 8th
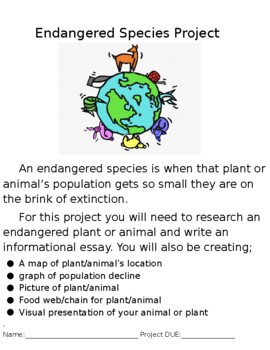
Endangered Species Project
This project encompasses writing about endangered animals. It conforms to NGSS standards as well as Common Core standards for ELA and Math (California). It contains a rubric, graphic organizer, and examples for students. This project can be edited to fit your classroom needs.
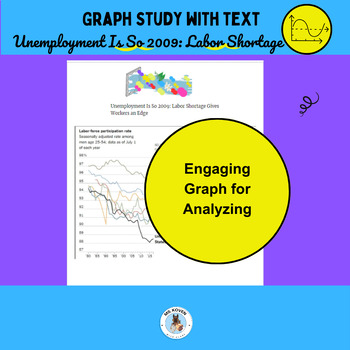
Analyzing Graphs: Unemployment & the Labor Market, Story Problems, Middle School
Students read a graph to delve into the labor market's intricate details with this comprehensive graph study kit. Students compose story problems based on the provided graph, integrating various mathematical processes like addition, subtraction, multiplication, or division involving whole numbers, decimals, fractions, or percents. This resource is versatile, ready to assign, aligning perfectly with real-world applications of mathematical concepts in understanding labor market dynamics.Product De
Subjects:
Grades:
6th - 8th
Showing 1-6 of 6 results


