5 results
Graphing Common Core HSS-CP.A.4 resources
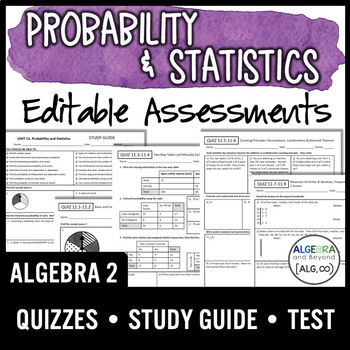
Probability and Statistics Assessments | Quizzes | Study Guide | Test
These assessments will help you assess your students' skills on probability and statistics! The EDITABLE assessments cover basic, compound, independent, dependent, and mutually exclusive events and probabilities. Students analyze scenarios for the counting principles, permutations, and combinations. Statistics included are measures of variation, frequency, normal distribution, and z-scores. Print and go OR edit to meet your standards.INCLUDED:4 Quizzes, a Study Guide, and a Unit TestTOPICS:Basic
Subjects:
Grades:
9th - 11th
Types:
CCSS:
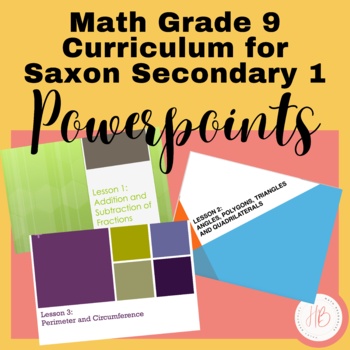
9th Grade Saxon Secondary 1 Math Powerpoints
These 120 Powerpoint lessons work hand in hand with the Saxon Algebra 1 math textbook. If you do not teach the Saxon program then these Powerpoints can be used to help teach the Secondary 1 Common Core. Each Powerpoint consists of a lesson overview which includes formulas and direct instructions. After that there are several practice problems that allows students to put into practice what they just learned. This is a great opportunity for group work as well as for the teacher to walk around the
Grades:
8th - 9th
Types:
CCSS:
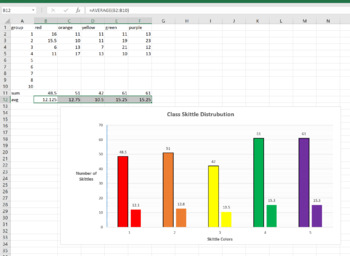
Skittle Statistics MS Excel Mini-Lab
This is a 1 class MS Excel lab for a computer or math class. You can have the students explore the distribution of different color Skittles in class. This is a great mini-lab or half-day activity when you school ends up with a weird schedule day. Tell them they can't eat till the Skittles till the end of class, or they will distort their numbers. Also make sure they don't throw them or shove them up their nose (Yes, stuck Skittles are hard to extract, ask me how I know..)The goal of this lab is
Grades:
6th - 12th, Higher Education, Adult Education
Types:
NGSS:
MS-ETS1-2
, HS-ETS1-2
, HS-ETS1-3
, MS-ETS1-4
, MS-ETS1-1
...
Also included in: Hands-on Science Semester Labs Bundle
6 Editable Bar Graph Templates 2.0
Finally a simple and professional graph space that students can fill out without any design issues getting in the way. This file contains 6 ready-to-use graph options. Print them and have students fill them with pencil and ruler, or distribute them over computer and let them practice entering the data. Get a project perfect finish every time. Maybe you just want to fill it out live on a projector? The possibilities are endless! It's okay to say you love these bar graphs. So do we.Contains:- 2 bl
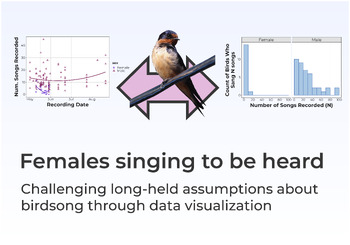
Females Singing To Be Heard: Interdisciplinary Science Mini-Unit
This FREE, interdisciplinary mini-unit is all about challenging long-held assumptions about birdsong through data visualization. The Gist: Students will learn how data visuals tell a story. They will analyze real bird song data to try to understand why female singing behavior has been overlooked in one of the most common birds in the world. They will also gain a deeper insight into the scientific peer review process.Driving Questions: What is the best way to visualize data?How do our assumption
Grades:
5th - 12th
CCSS:
Showing 1-5 of 5 results


