8 results
Common Core 7.SP.B.4 resources for SMART Notebook
Tree Diagrams and the Fundamental Counting Principle Smartboard Lesson
Teachers ~ You'll LOVE this! One of my best-selling Smartboard Lessons, that has 23 slides total. Great graphics and everything you'll need to teach Tree Diagrams and the Fundamental Counting Principle. Lots of interactive practice with students coming to Smartboard to solve problems too. You're students will love learning from these Smartboard Slides. WARNING: You MUST have SMART Technologies SMART software, and a SMARTBOARD to teach from, to effectively download, open and use this Interactive
Subjects:
Grades:
4th - 7th
Mean, Median, Mode, Range Smartboard Slides Lesson Measures of Central Tendency
You'll LOVE this great Data Measures-of-Central-Tendency: Mean, Median, Mode, & Range Smartboard-Slides-Lesson. Your students will LOVE this interactive smartboard lesson that teaches and practices Mean, Median, Mode, and Range, along with a Card Game for practice. YOU GET 28 slides total, a very comprehensive and complete lesson. You'll enjoy using this great smartboard lesson year after year. WARNING: You MUST have SMART Technologies SMART software, and a SMARTBOARD to teach from, to effec
Subjects:
Grades:
4th - 7th
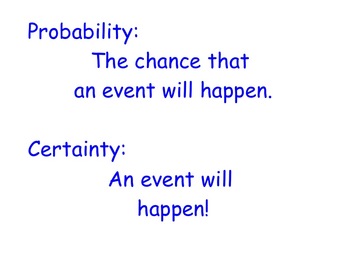
7th Grade CCSS Probability Unit Lessons
Complete 7th Grade CCSS Probability Unit Lessons.
This download includes all the lessons for the 7th grade probability unit and homework for each lesson. The entire lesson progression can be accessed for free on my site.
These lessons can be used independently or with video lessons that are available on my site. The video lessons are exceptionally useful with students that have been absent or are more advanced and need an independent study unit.
Subjects:
Grades:
6th - 8th
Median Mode Range Smartboard Slides Lesson Measures of Central Tendency
Incredible ~ 31 slides ~ Smartboard-Slides-Math-Lesson over Median, Mode, and Range (Measures of Central Tendency). This is EVERYTHING you need to teach these three measure-of-central-tendencies. Students will enjoy the interactive slides where they work problems at the Smartboard. Please be sure to see my other smartboard lesson on Finding the Mean, Average. You'll enjoy using this resource year after year. WARNING: You MUST have SMART Technologies SMART software, and a SMARTBOARD to teach from
Subjects:
Grades:
4th - 7th, Staff
Probability of Independent Events Using Sample Space Smartboard Slides Lesson
Probability-of-Independent-Events-Using-Sample-Space Smartboard-Lesson has lots of interactive practice for your students. 23 slides in all! Great graphics and problems! Your students will LOVE this lesson! You'll use it year after year! WARNING: You MUST have SMART Technologies SMART software, and a SMARTBOARD to teach from, to effectively download, open and use this Interactive Smartboard Lesson. Go to https://legacy.smarttech.com/en/products/education-software/smart-learning-suite/download/tr
Subjects:
Grades:
5th - 8th, Staff
Mean Finding the Average Central Tendency MEAN Smartboard Slides Lesson Data
Math Teachers ~ You'll LOVE this TERRIFIC MEAN, Finding-the-Average, Central-Tendency, Smartboard-Slides-Lesson that has 24 slides total and includes modeling as well as word problems. Students will love this interactive lesson ~ where they actively participate in solving for the MEAN (average). WARNING: You MUST have SMART Technologies SMART software, and a SMARTBOARD to teach from, to effectively download, open and use this Interactive Smartboard Lesson. Go to https://legacy.smarttech.com/en/p
Subjects:
Grades:
4th - 7th, Staff
Box and Whisker Plot Activity
In this editable Smart Notebook document, students will practice making box and whisker plots while gather data. The document also focuses on stem and leaf plots and mean, median and mode.
Subjects:
Grades:
5th - 8th
CCSS:
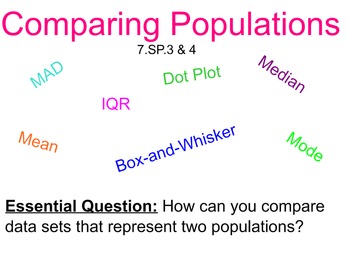
Comparing Populations
Comparing populations using mean, median, mode, box-and-whisker plots, dot plots, stem-and-leaf plots
Subjects:
Grades:
6th - 8th
Types:
Showing 1-8 of 8 results

