7 results
Valentine's Day Common Core 6.SP.A.3 resources
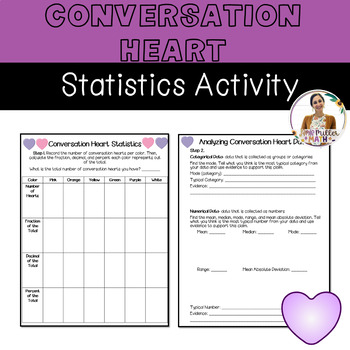
Conversation Heart Statistics Activity
The Conversation Heart Statistics Activity is a fun and festive way to celebrate Valentine’s Day while practicing math skills. Students will receive a pack of conversation hearts or a certain amount if you purchase bags. Students will record the number of conversation hearts per color, and then identify the fraction, decimal, and percent each color represents of the total. Students will then analyze the data by finding the mean, median, mode, range, and mean absolute deviation. Students will cre
Subjects:
Grades:
5th - 8th
Types:
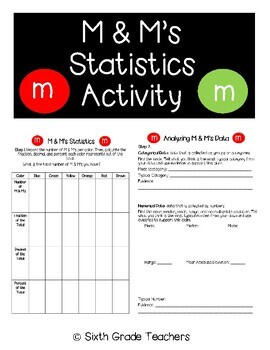
M & M's Statistics Activity
The M & M’s Statistics Activity is a fun and engaging way to practice math skills! This product includes versions that can be used anytime of the year (regular M & M’s), during the holiday season (red and green M & M’s), during Valentine’s Day (Valentine’s Day M & M’s), or during spring/Easter (Easter M & M’s). Students will receive a pack of M & M's or a certain amount if you purchase bags. Students will record the number of M & M's per color, and then identify the f
Subjects:
Grades:
5th - 8th
Types:
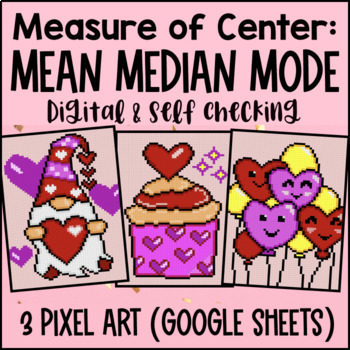
Mean Median Mode Digital Pixel Art Measures of Central Tendency & Center
Take measures of central tendency practice to the next level with pixel art! Students practice finding the mean, median, and mode of different datasets across 3 pixel art activities with 36 problems total. It's a perfect addition to your data & statistics unit.These self-checking Google Sheets give students instant feedback. Incorrect answers are highlighted in red, and correct answers turn green and unlock parts of a mystery picture. They’re easy to assign, keep students engaged, and free u
Subjects:
Grades:
6th - 7th
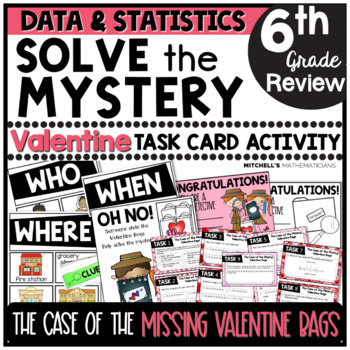
6th Grade Data & Statistics Solve The Mystery Valentine's Day Task Card Activity
I am excited to share this Valentine's Day MYSTERY CHALLENGE activity with you and your students! You will begin this activity by reading a short story that will challenge your students to solve the case of the missing valentine bags. They will have to find out who took the bags, when they took them, and where they put them. To solve the case, students will work to complete 9 different task cards. The task cards are based on the statistics and probability common core state standards. Once they c
Subjects:
Grades:
5th - 7th
Types:
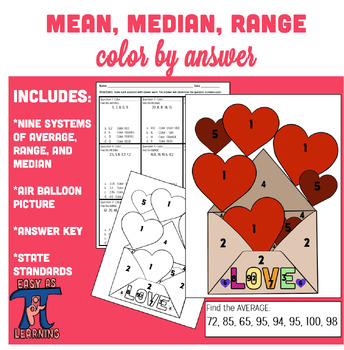
Valentine's Day Activity- Mean, Median, and Range Color by Answer Activity
Valentine's Day Special: Mean, Median, and Range Color by Answer ActivityGet ready to spread love and math magic this Valentine's Day with our adorable Mean, Median, and Range Color by Answer activity!In this delightful activity, students will embark on a journey of numerical exploration as they tackle nine fun-filled questions to find the mean, median, and range of various numerical data sets. But that's not all! Once they've found the answers, they'll use their mathematical prowess to color a
Subjects:
Grades:
5th - 9th
Types:
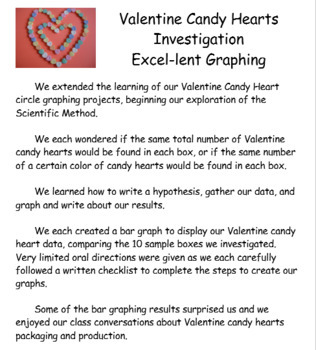
Excel Graphing Valentine Candy Hearts Investigation
#welovecandyheartsThis integrated Math/ Science/ Technology project is a great way to make statistics and probability real, relevant, fun, and delicious!Students will create bar graphs using Excel to display Valentine candy hearts data, as students consider packaging and production of small Valentine candy heart individual boxes. Project file includes sample bulletin board display poster, project directions in individual student checklist form, and rubric to grade the finished graph.Project file
Grades:
5th - 7th
Types:
NGSS:
3-5-ETS1-2
, MS-ETS1-3
Sweetheart Date-A Analysis Project
In this summative assessment students work collaboratively using a box of sweethearts to develop statistical questions, collect data, calculate measures of central tendency and variability, and create appropriate graphs for the data set. This project includes a self-assessment and rubric. Check out my IB Checklist for Groupwork to help students be accountable.
Subjects:
Grades:
6th - 8th
Types:
Showing 1-7 of 7 results


