20 results
Higher education Common Core 7.SP.C.8 resources
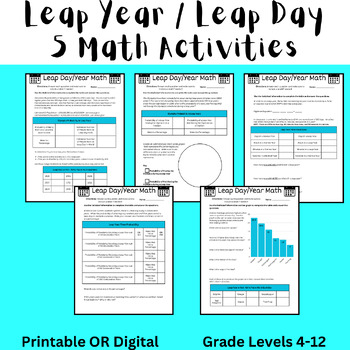
Leap Day (Leap Year) 2024 Math Activity (Algebra and Data) Digital or Printable
These 5 activities are fun NO PREP math activities to do to celebrate Leap Day 2024 (Leap Year 2024). The activities can be completed as 5 separate pages or as a 5 page packet. There is a customizable digital resource (Google Document) and a printable resource (Canva) that contain the same directions and activity. This was designed for students in middle school, but could be used for upper elementary and high school students in Pre Algebra, Pre-Algebra, or Algebra. In this assignment, students
Subjects:
Grades:
4th - 12th, Higher Education, Adult Education
Types:
Also included in: Leap Year (Leap Day) 2024 Bundle - Math, Reading, Writing, and Trivia
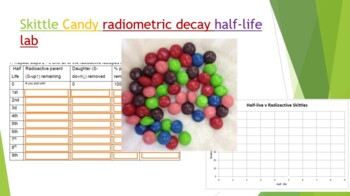
Skittle Radiometric Decay Half-life Lab
Did you know you can use Skittles candy to demonstrate absolute dating and radiometric decay! Buy a 1-4 lb bag at your local bulk warehouse store for savings. This lab is a great way to show how isotopes decay by shaking a plate full of random skittles. Students use Skittles to observe "Isotopes" decay over each half life. At the end of the lab (and only IF they have done all their work) they can enjoy their "daughter products". Skittles were used because they are durable, hypoallergenic, and th
Subjects:
Grades:
8th - 12th, Higher Education, Adult Education
Types:
NGSS:
HS-PS1-8
, HS-PS1-1
, HS-PS1-4
, HS-PS1-6
, MS-PS1-4
...
Also included in: Hands-on Science Semester Labs Bundle
Intro to Probability Worksheet Bundle + Empirical & Theoretical Probability Lab
The following worksheets provide an introduction to probability suitable for a college course in quantitative literacy as well as a discussion of probability in middle or high school.The worksheets include topics in empirical and theoretical probability, odds, expected value, tree diagrams, and probabilities with "and" & "or".If you are not interested in all worksheets, please feel free to check out their individual listings below:Empirical and Theoretical Probability WorksheetOdds Against a
Subjects:
Grades:
8th - 10th, Higher Education
Types:

Unit 9: Data and Statistics Fillable Notes
Unit 9: Data and Stats(No 9.3/ Skip)9.1 Central Tendencies: Mean, Median and Mode9.2 Graphical Data: Bar Charts, Dot Plots and Histograms9.3 NONE9.4A 5 number summary and box and whisker plots 9.4B Standard Deviation9.5/9.6 Data Distributions (skewness) left or right9.7 Frequency Tables and relative frequency tablesStudents go over the vocabulary and complete the examples with the vocabulary scaffolded. Notes are scaffolded. Includes hook video hyperlinked on the "learning objective" title. Key
Subjects:
Grades:
6th - 12th, Higher Education, Adult Education
Introduction to Probability Lesson using Fair Games
This is an activity-based lesson on basic probability, chance, and operations including addition, multiplication, and equivalent fractions. It can be used with a wide variety of grade levels including elementary, middle, and high school as well as with adults. The game approach is one that students LOVE and can be revisited over and over in a scaffolded lesson design to build understanding of probability and chance. It does not require a lot of materials so it is low cost.
You can see a full
Subjects:
Grades:
2nd - 12th, Higher Education, Adult Education
Types:
Tree Diagrams: Probability Worksheet
This math worksheet is designed to give students an opportunity to construct tree diagrams to find sample space points and to determine probabilities. Students are also encouraged to use the counting principle to make sure that they have found all possible outcomes.Students will also calculate probabilities of outcomes with keywords such as "at least", "exactly", "and", and "or" by using tree diagrams and sample space points.The answer key is attached.If you would like your students to have a be
Subjects:
Grades:
7th - 9th, Higher Education
Types:
Also included in: Intro to Probability Worksheet Bundle
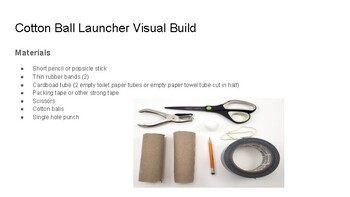
Project Based Learning Cotton Ball Launcher Visual Build Guide
10 Reasons Why You Will Want to Purchase this Hand ON Activity!1. It will keep kids entertained.2. Kids will be engaged with their activity.3. FEWER BEHAVIOR INCIDENTS4. Kids will enjoy their work activities.5. It is just plain fun.6. State Standards Align.7. Kids are actively engaged.8. Sequential Activity9. Bloom's higher-order thinking and process skills center 10. Student-led.
Subjects:
Grades:
1st - 11th, Higher Education, Adult Education, Staff
Types:
Micro:bit An Introduction
In these lessons you will use the Micro:bit simulator to create a coin toss game and a dice game. Use these games to teach randomness and probability. The skills learned in the simulator are fully applicable to the physical Micro:bit.
Grades:
2nd - 12th, Higher Education, Adult Education, Staff
Types:
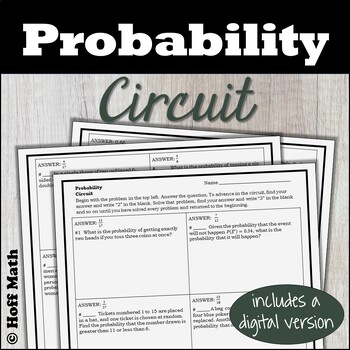
Probability CIRCUIT with worked solutions | DIGITAL and PRINT
Students practice problems involving probability in this engaging, self-grading, low-prep circuit worksheet that includes the worked solutions for the convenience of the teacher.The digital version uses Google Forms(TM)Click HERE to SAVE 30% by buying my Slow Growing Precalculus Bundle. As I add more Precalculus products to my store, they will get added to this bundle. That means you get a discount on the products already included, and then you can re-download to get any future Precalculus prod
Subjects:
Grades:
11th - 12th, Higher Education
Types:
CCSS:
Also included in: Probability Homework Bundle | Digital and Print
Math Notebook
My students call this their "Math Bible". It has a one page of notes for each lesson of Pre-Algebra.Skills in here are used in 5th-12th grade. & definitely beneficial for homeschool use. I have students either glue them into their own notebook or I will hole punch and have them put into a folder/binder.Other teachers have asked for this notebook to refresh their memory.
Subjects:
Grades:
5th - 12th, Higher Education, Adult Education, Staff
Basics of Probability
This Power Point includes the basic definitions of probability, including the probability equation, vocabulary including classical, empirical, and subjective probability, and complementary events. It includes examples throughout.
Subjects:
Grades:
9th - 12th, Higher Education
Types:
CCSS:
Also included in: Probability and Statistics PowerPoints
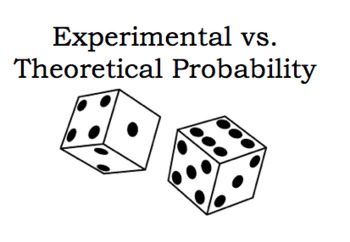
Experimental vs. Theoretical Probability
Students will learn how Experimental and Theoretical Probability are different. Students will find the probabilities when rolling two dice and adding their values together. Students will find the experimental probabilities by rolling dice, and the theoretical probabilities by looking at all possible outcomes.Materials: Students will need 2 six sided dice to complete the activity.
Subjects:
Grades:
7th - 12th, Higher Education
Types:
Empirical and Theoretical Probability Worksheet
The attached file is a worksheet designed to give students an opportunity to calculate empirical and theoretical probability. After each main question, students are also asked to identify whether the probability that they just calculated is an empirical or theoretical probability. This worksheet was designed for a college freshman course, Quantitative Literacy, but can easily be used in any course that asks students to differentiate between empirical and theoretical probability and complete basi
Subjects:
Grades:
7th - 9th, Higher Education
Types:
Also included in: Intro to Probability Worksheet Bundle
Passion-Driven Statistics E-book (Introductory/AP Statistics Course Textbook)
Passion-Driven Statistics is an NSF-funded, multidisciplinary, project-based curriculum that supports students in conducting data-driven research, asking original questions, and communicating methods and results using the language of statistics. The curriculum supports students to work with existing data covering psychology, health, earth science, government, business, education, biology, ecology and more. From existing data, students are able to pose questions of personal interest and then use
Subjects:
Grades:
6th - 12th, Higher Education, Adult Education
Types:
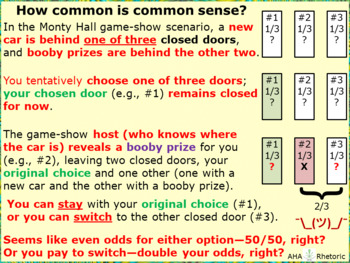
Monty Hall Common Sense: maybe slow down your fast-thinking and do the math
This critical-thinking problem asks you to select 1 of 3 doors to possibly win a prize. After new info, you may then switch your selection. Do you make a quick, gut-level decision, or you do you do the math? This PPT-size animated GIF (5-frame, 4 seconds each, 2 cycles) can be used as a PPT slide that animates when in slide-show mode; it can also be used as a bell-ringer for any class that deals with critical thinking or conditional probability, etc. Image size 960×720 (file size 665 KB). Note 1
Subjects:
Grades:
9th - 12th, Higher Education, Adult Education
Types:

SPSS software Secondary Data Analysis Workshop (Introductory/AP Statistics)
This handout is intended for those interested in teaching/learning basic introductory statistics concepts to analyze real data. Students will learn how to tell a story using secondary data analysis. The handout is for SPSS and the US Longitudinal Study of Adolescent Health data set. For handouts on the data set code book and raw data file, a PowerPoint to accompany the handout, or questions please email kristin.flaming@gmail.com or ldierker@wesleyan.edu.This handout was developed as a condensed
Subjects:
Grades:
6th - 12th, Higher Education, Adult Education
Types:

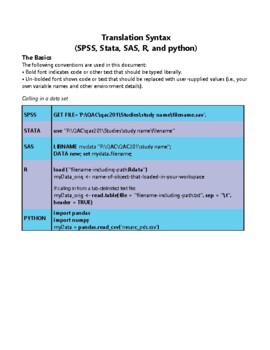
Translation Code
As part of our NSF-funded passion-driven statistics project, we have just started to share more widely our “translation code” aimed at supporting folks in learning code-based software and in moving more easily between them. The pdf includes all of the basic syntax for managing, displaying and analyzing data, translated across SAS, R, Python, Stata and SPSS. http://bit.ly/PDSTranslationCode.For more information about our warm and welcoming data-driven curriculum, check out https://passiondrivenst
Grades:
6th - 12th, Higher Education, Adult Education
Types:

R software Secondary Data Analysis Workshop (Introductory/AP Statistics)
This handout is intended for those interested in teaching/learning basic introductory statistics concepts to analyze real data. Students will learn how to tell a story using secondary data analysis. The handout is for R or R Studio, a free cloud based system and the US Longitudinal Study of Adolescent Health data set. For handouts on setting up a free R account, the data set code book and raw data file, a PowerPoint to accompany the handout, or questions please email kristin.flaming@gmail.com or
Subjects:
Grades:
6th - 12th, Higher Education, Adult Education
Types:
STATA software Secondary Data Analysis
This handout is intended for those interested in teaching/learning basic introductory statistics concepts to analyze real data. Students will learn how to tell a story using secondary data analysis. The handout is for STATA software and the US Longitudinal Study of Adolescent Health data set. For handouts on setting up an account, the data set code book and raw data file, a PowerPoint to accompany the handout, or questions please email kristin.flaming@gmail.com or ldierker@wesleyan.edu.This
Grades:
6th - 12th, Higher Education, Adult Education
Types:

SAS software Secondary Data Analysis Workshop (Introductory/AP Statistics)
This handout is intended for those interested in teaching/learning basic introductory statistics concepts to analyze real data. Students will learn how to tell a story using secondary data analysis. The handout is for SAS (email for R, SPSS, Stata, & Python), a free cloud based system and the US Longitudinal Study of Adolescent Health data set. For handouts on setting up a free SAS account, the data set code book and raw data file, a PowerPoint to accompany the handout, or questions please e
Grades:
6th - 12th, Higher Education, Adult Education
Types:
Showing 1-20 of 20 results

