5 results
Preschool other (specialty) resources for Microsoft Excel $10 and up
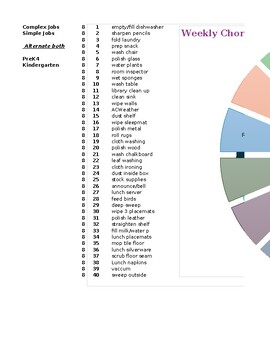
Chore Wheel/Pie chart
This pie chart was designed to be used in a Montessori classroom to assign weekly tasks to students in Practical Life/ chores. This can be downloaded and edited. The outer donut are the student names to be rotated every Monday. The inner donut is related to the list of jobs. They are organized alternating simple and complex jobs so each student can have up to 3 jobs daily. Repetition is the best teacher and will help them perfect and refine their work.
Subjects:
Grades:
PreK - 3rd

Attendance Graphs (for absences and tardies)
The Excel file will, in tandem from your Student Information System, will graph the minutes of instruction that a student has missed up to the date you you choose (we try to use it quarterly). If you have an electronic method of tracking tardies, you can add that data too and the graph will discriminate between minutes/% missed by each. The sheet is set up to graph up to 50 students on this page. The instructions for use on on the second worksheet of the workbook. For absences, your SIS should g
Grades:
PreK - 12th, Staff
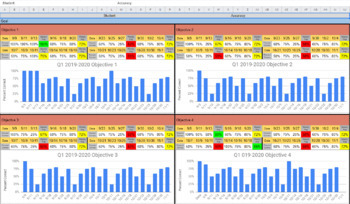
IEP Data Collection FREE Updates
This product can be used to help teachers monitor progress of student IEPs. There are three data points per objective, if you need more feel free to contact me and I can make it happen. If the student's weekly average falls below 50%, it highlights the cell red. If it is between 51%-79%, it highlights the cell yellow. If it is 80% or above, it highlights the cell green. When a student is absent, simply put in A, and the cell will highlight so that you have a visual for how many times the student
Subjects:
Grades:
PreK - 5th
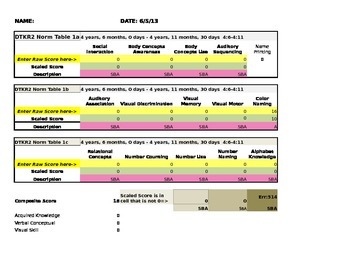
DTKR2 Calculation Tool: Developmental Tasks for Kindergarten Readiness
This spreadsheet is a data tool that takes raw scores and translates them into composite and scaled scores.
Its purpose is to streamline the calculation process involved in finding the composite and Scaled Scores.
Grades:
PreK - K
ABA Autism Graph Template
Easily graph multiple graphs within one single file. Easily shared with parents, administrators and child study teams. Easy to use and professional. American Psychological Association based. Colors can easily be added.
Subjects:
Grades:
PreK - 12th
Types:
Showing 1-5 of 5 results


