15 results
Kindergarten critical thinking statistics resources for Microsoft Excel
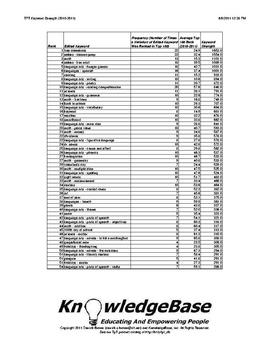
TPT KeyWord Strength Index (2010-2011) - Downloadable Spreadsheet!
What are the strongest keywords on TpT?
1. free downloads
2. Deanna Jump
3. math
Neither #1 nor #2 are surprises, but #3 (math) was certainly a surprise to me!
This report analyzes TpT's 2010-2011 keywords using a measure called "keyword strength".
The measure is based on a keyword's average rank, as well as the number of times it appeared in the 2010-2011 "Top 100" TpT search engine rankings.
This can be a valuable tool to help sellers understand TpT's marketplace supply and demand!
The P
Subjects:
Grades:
PreK - 12th, Higher Education, Adult Education, Staff
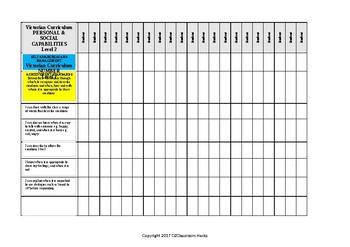
Personal and Social Capabilities Level 2 Checklist Victorian Curriculum
Here are the SELF and SOCIAL capabilities as outlined in the Victorian Curriculum, and translated into an easy 'I Can' checklist for use in your room. Know exactly where to level your students for reports!
*Levels 1 and 2 are fairly similar with only a few differences.
*If you like my products, don't forget to FOLLOW me to see when new ones are added.
OZClassroom Hacks
Make Life Easy
Grades:
PreK - 3rd
Types:
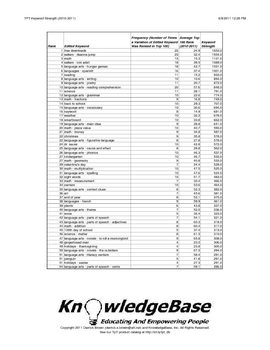
TPT KeyWord Strength Index (2010-2011) - Downloadable PDF!
What are the strongest keywords on TpT?
1. free downloads
2. Deanna Jump
3. math
Neither #1 nor #2 are surprises, but #3 (math) was certainly a surprise to me!
This report analyzes TpT's 2010-2011 keywords using a measure called "keyword strength".
The measure is based on a keyword's average rank, as well as the number of times it appeared in the 2010-2011 "Top 100" TpT search engine rankings.
This can be a valuable tool to help sellers understand TpT's marketplace supply and demand!
The P
Subjects:
Grades:
PreK - 12th, Higher Education, Adult Education, Staff
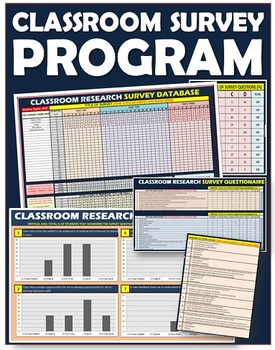
Surveys: Classroom All-IN-ONE Research Program
Empower Your Teaching with Data: Enhance Your Classroom with Powerful Survey Analysis!Elevate your teaching practice by leveraging the power of data with this user-friendly survey analysis program.Here's what sets it apart:Effortless Data Visualization: Transform survey responses into clear and visually appealing charts and graphs.Actionable Insights: Gain valuable insights into student learning styles, preferences, and areas for improvement.Informed Decisions: Make data-driven decisions to enha
Subjects:
Grades:
PreK - 12th, Higher Education, Adult Education, Staff
Types:

Math TEKS standards checklist for K-12th grade (TX)
Mathematic TEKS standards checklist for K-12th grade. These are on an Excel spreadsheet with 5 columns for data input and separate tabs for the strands. These standards are organized in their separate strands to coordinate lessons. Please see my free file for an example.
Subjects:
Grades:
K - 12th
Types:
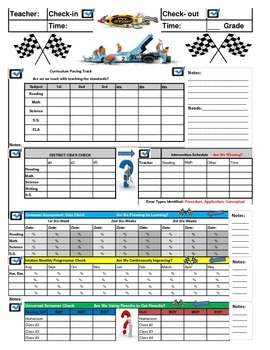
The PIT-STOP CHECK-IN Goal Folder System for School Administrators:
At times it appears that we are always in a race to master rigorous content standards at every grade-level. As administrators we must actively monitor our classrooms to ensure that adequate progress is occurring school-wide. In an effort to ensure that our teachers are continuously improving academically, I designed a check-in goal folder system for teachers to confirm that as a campus we are maintaining our goal focus towards continuous improvement. In order to do so, we are having every inst
Grades:
PreK - 8th
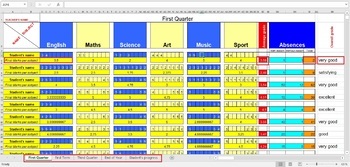
Calculate Student's Final Marks ( Grades ) in excel
If you want to easily calculate student's marks this excel document is great solution. I added all excel's necesarily formulas to make this important task so easier.When you add the marks for every subject, it's final mark will be automatically calculated. At the same time average grade will also be calculated and updated.There is also section for absences (excused and unexcused) which will also be calculated.At the end, if student's Overall grade is equal or above 4.5, it will be automaticaly w
Subjects:
Grades:
PreK - 12th, Higher Education, Adult Education, Staff
Types:
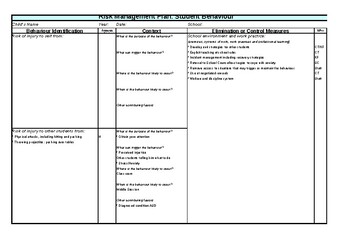
Excel - Risk Management Plan: Student Behaviour
This resource is an editable resource created in Excel which provides both teachers, SEND workers, support staff and parents a pro forma to identify potential behaviours which may put students at risk of injury to themselves or others, identify the context and highlight the elimination or control measures that need to be put in place to resolve the issue. This resource has been used extensively through my years of teaching (Over 12+ years) and never fails to be a clear record of the behaviours a
Grades:
PreK - 12th, Higher Education, Adult Education, Staff
Also included in: Behaviour Management Tools/Trigger Identification Trackers
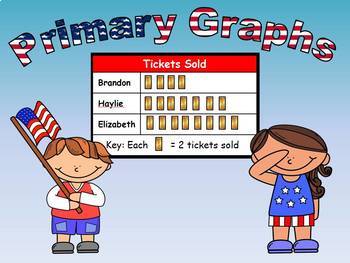
Primary Graphs Unit (Line Plot, Bar, Pictograph, Pie, and Line)
This compressed files contains all the materials you need to teach your primary students about graphing 7 different data surveys as line plots, bar graphs, or pictographs. Inside the folder is a PowerPoint presentation to teach the concepts as your students complete each of the 7 graphs. (There is also an equivalent SmartBoard Notebook presentation of the same lesson)• CCSS.Math.Content.1.MD.C.4• CCSS.Math.Content.2.MD.D.10Also included is an Excel spreadsheet that will show your primary student
Subjects:
Grades:
K - 2nd
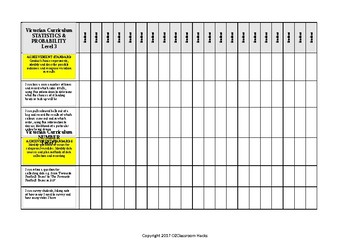
Mathematics STATISTIC PROBABILITY Checklist Level 3 Victorian Curriculum 'I Can'
Level 3 Statistics and Probability Checklist aligned with the Victorian Curriculum. Fed up with recreating new checklists - ME TOO! Hope this helps. Here is a checklist completely aligned with the Victorian Curriculum. All put simply in 'I Can' statements as YOU WOULD TEACH IT!
MAKE LIFE SIMPLE! Teaching is time consuming enough.
Subjects:
Grades:
PreK - 6th
Types:
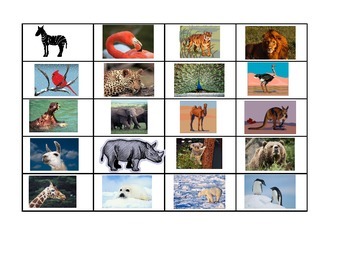
Data Set: Animals Around the World
Students categorize and create stories using these themed cards. Once they have put the cards into categories they explain their rationale for their groups OR if they created a story using the cards, they share their story. Then they mix up the cards and start agin; creating new categories or stories.
Subjects:
Grades:
K - 2nd
Types:

Easy Breakout Session Games for Microsoft Excel Digital
Students are thrilled with the Breakout Game! This gives Students two sets of puzzles for the Breakout Sessions. They must use the code from the first part to answer the second part. This is a great way to review the basics of Excel. Students get the challenge to be a member of the Codebreakers Club.This is based on the adult game of Escape Room.Created by CC FisherFor Older GradesBreakout Session Games for Microsoft Excel
Grades:
K - 2nd
Types:
Also included in: Microsoft Excel YEARLY Bundle For Younger Students Digital

Early Learner Spreadsheets (Using Colors) Cell References
Use these activities to help early learners of spreadsheets understand Rows and Columns and where intersection of Cells occur. Also helps with using fill and colors, and adding images to a spreadsheet worksheet.Instructions include working with Google Sheets, Excel, and Numbers.A corresponding Easel Activity is included.Great activities that are sub-ready.
Grades:
K - 4th
Types:
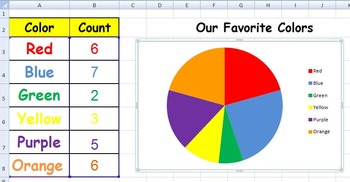
Graph Our Favorite Colors
This Excel spreadsheet will show your primary students the same data in a pie graph, a bar graph, and a line graph. You just need to survey your students about their favorite color and input the numbers into the graph. (When you first look at the graph, no data will be shown.)This spreadsheet offers more graphs:Primary Graphs Unit
Subjects:
Grades:
K - 2nd
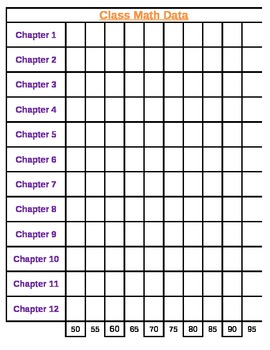
Math Class Data Sheet
Great for a class Data Wall!
This is an excel spreadsheet used to track yearly growth.
Enjoy!
Subjects:
Grades:
K - 12th
Showing 1-15 of 15 results

