4 results
Graphing bulletin board idea interactive whiteboards

St.Patrick's Day Math Activity
Teachers fill up ziplock bags of Lucky Charm cereal and distribute bags to small groups of students. Students count the total number of oats and different types of marshmallows. After adding up all of the totals, they find the rang, mean, median, and mode of their data set. They then collect the other groups data and analyze the whole class totals.
Subjects:
Grades:
5th - 7th

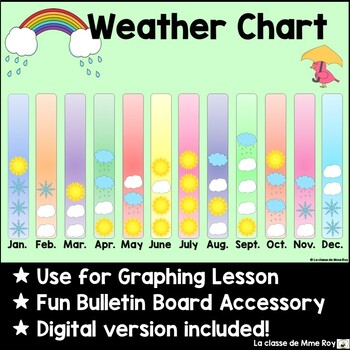
Weather Chart - Math Graphing - Bulletin Board (Digital Version included)
Here is a fun and colourful way to keep track of the weather with your students. You can print the different weather charts to make a bulletin board display or use the digital file included to track the weather on your classroom projected display (e.g. SMARTBoard). The weather charts can be printed as posters in whatever size you would like using the "Poster" printing option in Adobe.You can also print the charts for students to graph the weather individually by cutting and pasting the appropr
Grades:
K - 4th

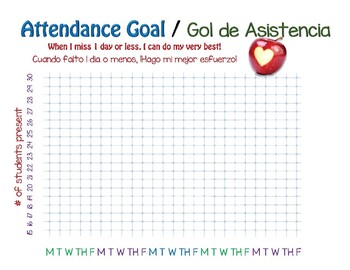
Classroom Attendance Poster Chart
This English/Spanish Attendance chart can be printed in poster size, or any size you might need to graph and chart your students daily and monthly attendance. Works great for morning meetings to help your students improve their classroom attendance.
Subjects:
Grades:
Not Grade Specific

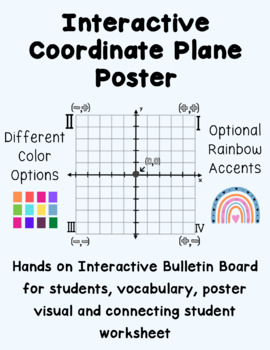
Interactive Coordinate Plane Poster
Hands on Interactive Bulletin Board for students, vocabulary, poster visual and connecting student worksheetUse these labeled points on the laminated graph as temporary points as an interactive bulletin board.Have students graph on following pages and label on chart each time the interactive graph is changed.Different Color OptionsOptional Rainbow Accents
Subjects:
Grades:
5th - 12th
Showing 1-4 of 4 results


