74 results
Common Core HSS-MD.A.2 resources under $5
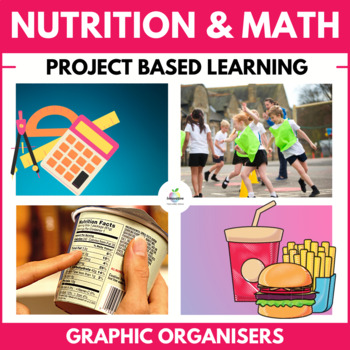
Food & Nutrition Labels | Healthy Eating Math Unit | Statistics & Data | PBL
Teach your students the importance of HEALTHY EATING with this engaging NUTRITION LABEL reading unit. Students will learn to evaluate nutrition labels and make informed choices about DIET and the foods they consume.This NO-PREP, MULTIDISCIPLINARY MATH UNIT will keep them engaged as they learn about FAST FOOD, what they are putting in their mouth, and the amount of activity required to burn it off. AN ESSENTIAL LIFE SKILL.Most students love ♨️FAST FOOD♨️; maybe it's a guilty pleasure, but do we
Subjects:
Grades:
4th - 9th
Also included in: Innovative Substitute Teaching Bundle | No Prep Sub Plans

Expected Value Whodunnit Activity - Printable & Digital Game Options
Nothing like a good criminal investigation to liven up expected value! Based off my popular CSI projects, I have created Whodunnits? The Whodunnits plan to focus on single content topics as opposed to units and will focus more on skill building than application. Every day can't be a project day, so Whodunnits can be an engaging out of their seat activity to practice important skills. In a Whodunnit?, students will work in teams to solve 10 practice problems that increase in difficult. After each
Subjects:
Grades:
7th - 12th
Types:
CCSS:
Also included in: Probability & Expected Value Unit Bundle - Distance Learning Compatible
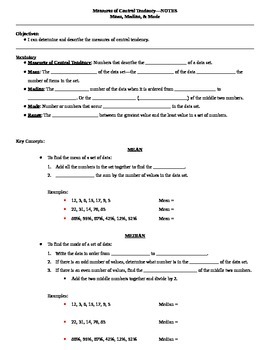
Measures of Central Tendency Guided Notes
These are guided notes for a lesson on measures of central tendency including mean, median, mode, and range. There are several examples in the notes and the same data sets are used to show each measure of central tendency.I have also included a teacher key to show you what to fill in the blanks as your students follow along.To use these notes, I simply projected them onto my whiteboard, gave the students their blank copies, and had them follow along and write what I wrote. This works great when
Subjects:
Grades:
5th - 12th
CCSS:
Mean and Standard Deviation of Probability Distributions (Lesson with Homework)
Elementary Statistics - Mean and Standard Deviation of Probability DistributionsCommon Core Aligned Lesson with HomeworkThis lesson plan includes:-Lecture Notes (PDF, PowerPoint, and SMART Notebook)-Blank Lecture Notes (PDF and SMART Notebook)-Homework (PDF and Word)**Homework Note: There are two questions about finding z-score, which is a previous lesson and is not addressed in the lesson notes.-Answer Key (PDF)You do not need to have PowerPoint or SMART Notebook to receive the full benefits of
Subjects:
Grades:
10th - 12th, Higher Education
CCSS:
Also included in: Distributions of Data Lesson Plan Bundle
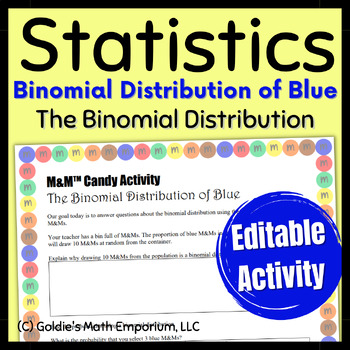
Statistics Activity The Binomial Distribution
Fun with StatisticsThe Binomial Distribution using M&M™ candy In this activity, students will practice setting up a binomial distribution and finding their probabilities. They will compare theoretical and empirical probabilities by sampling blue M&M candies from a population. This activity can be used with your AP Statistics or regular level statistics class. These are the following skills covered: Math Common Core Standards, High School: Probability and StatisticsDefine a random variabl
Subjects:
Grades:
10th - 12th
Types:
CCSS:
Also included in: Statistics Chocolate Candy Activity Bundle
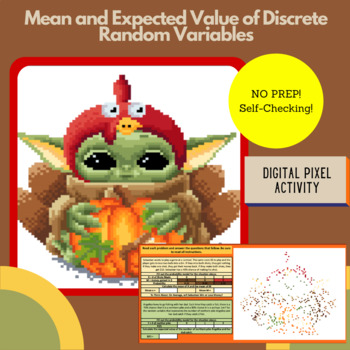
Mean and Expected Value of Discrete Random Variables - AP Stats Digital Reveal
~~ Watch the Video Preview to See All Questions included ~~In this activity, students will practice finding probability distributions, and finding the mean (or expected value) of each distribution. As students type in the correct answer, a piece of the pixel image appears, providing them with instant feedback and instant student buy-in! This activity reveals a Thanksgiving inspired mash up picture that is perfect to use right before our fall break!Mystery Reveals in Education are a great way to
Subjects:
Grades:
9th - 12th
Types:
CCSS:
Also included in: AP Stats Digital Activities for all chapters!
AP Statistics Kahoots (10 total): No Prep game/activity for AP Statistics Exam
Get ready to supercharge your AP Statistics exam prep with these 10 Kahoot links! With 10-15 questions in each Kahoot, your students will have daily practice to help them ace the exam at the end of the year. These Kahoots are specifically designed using AP test material, so you can be sure your students are getting the best preparation possible. Perfect for quick spiral review, warm-ups, or closing out class, these Kahoots are the ultimate tool for helping your students succeed. And with the opt
Subjects:
Grades:
10th - 12th
Types:
CCSS:
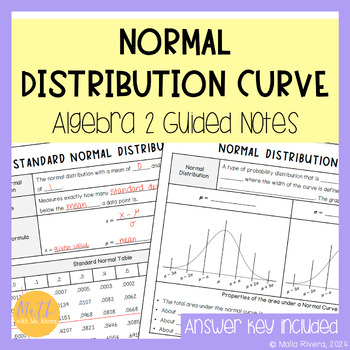
Normal Distribution Curve Guided Notes for Algebra 2 No Prep
This set of guided notes will walk Algebra 2 students through understanding and calculating normal distribution curve and z-scores. All you need to do is print & make copies for your students! A suggested, detailed answer key is included for all pages. Topics included:Properties of the Normal Distribution CurveFinding probability distributionsStandard Normal Distribution CurveCalculating z-scores & probabilitiesThese notes are perfect to use as a handout or easily hole-punched and added
Subjects:
Grades:
10th - 11th
CCSS:
![Preview of Expected Value Quiz [2 Versions with Answer Keys]](https://ecdn.teacherspayteachers.com/thumbitem/Expected-Value-Quiz-2-Versions-with-Answer-Keys--11526191-1714690274/original-11526191-1.jpg)
Expected Value Quiz [2 Versions with Answer Keys]
This is a quiz to assess students' understanding of expected value.One problem involves picking a bill out of a box. Students must know the difference between the objects and the weights and how to use both to find the expected value.The other problem concerns the outcomes of rolling three dice at once. Students need to know how to find the total number of possible outcomes, use the weights, and use the complement to find the expected value of the game.The two problems are broken down into small
Subjects:
Grades:
11th - 12th
Types:
CCSS:
Probability & Expected Value Game - Small Group TableTop Practice Activity
Bring the TableTop Game revolution to your classroom! Board games are experiencing a renaissance and tapping into their innate engagement is a no brainer. This is the natural evolution of task cards. TableTop Math games cover a single unit of math study. The questions range from simple skill practice to application. Provided are four different game styles that can be played with the same set of math cards. Mix it up or let your students choose what to play. The choice is yours! In Journey, stude
Subjects:
Grades:
6th - 10th
Types:
Also included in: Probability & Expected Value Unit Bundle - Distance Learning Compatible
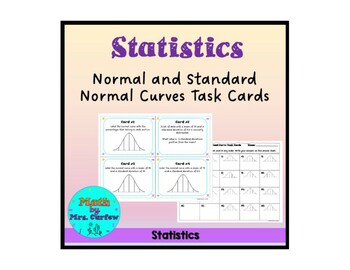
Statistics - Normal Distribution and Curves Task Cards
Do you need your student to get more practice creating normal distributions, normal curves, using the empirical rule, working with a bell curve, calculating the z score of a normal distribution, and finding the area/probability of a region under the curve between certain values? I know my students did, so this is what I created for them!There are 20 task cards in this set practicing just those types of problems. There is an answer sheet with blank normal curve graphs on them so they can work th
Subjects:
Grades:
10th - 12th, Higher Education
Types:
CCSS:
Also included in: Statistics (Full Year) - Additional Activities Bundle
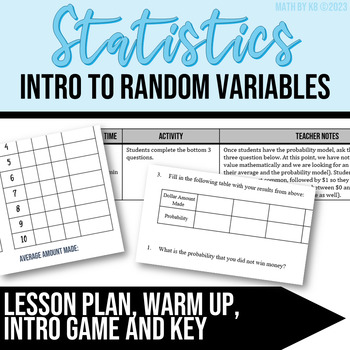
Discrete Random Variables
This activity is an introduction for students about discrete random variables. It allows them to explore how to make a probability distribution table and investigate desired probabilities and expected values. Students need to understand that probability is the desired number of outcomes divided by the total number of outcomes and the multiplication rule for independent events. Students do not need to have a strong background of random variables (this is made to be an introduction). Question #6 a
Subjects:
Grades:
9th - 12th
Types:
CCSS:
Also included in: Random Variables
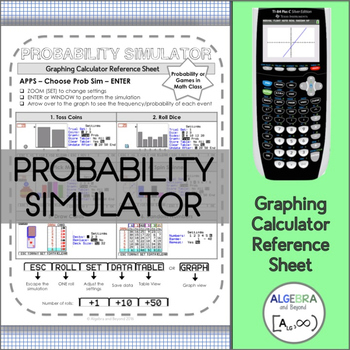
Probability Simulator | TI-84 Graphing Calculator Reference Sheet
This graphing calculator reference sheet shows students how to utilize the Probability Simulator App on the graphing calculator. This resource is great to use with a probability unit OR when students need to roll dice, spin a spinner, etc. to play a game in math class!Teaching graphing calculator skills help students with: • Speed• Making connections• Checking for accuracy• Leaping hurdles*Reference sheet can be used with a TI-83 or TI-84 graphing calculator.Please look at the preview to find ou
Subjects:
Grades:
8th - 12th
Types:
CCSS:
Expected Value Printable & Digital Activity - Baseball Mathlete
***THIS PRODUCT HAS BEEN UPDATED WITH A GOOGLE SLIDES INTERACTIVE VERSION INCLUDED. REDOWNLOAD IF YOU HAVE IT ALREADY***Mathlete Sports Tasks are hypothetical situations geared to a sports fan that require them to step inside the white lines! Millions of students and teachers enjoy sports and these tasks leverage the vast math applications and layer them critical thinking skills. Students must analyze data, perform calculations, construct multiple arguments with the data, AND make a decision. Al
Subjects:
Grades:
7th - 12th
Types:
CCSS:
Also included in: Probability & Expected Value Unit Bundle - Distance Learning Compatible
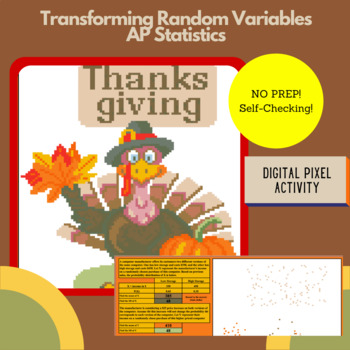
Transforming Random Variables - AP Statistics Thanksgiving Digital Reveal
~~ Watch the Video Preview to See All Questions included ~~In this activity, students will practice finding the mean and standard deviation of probability distribution and transforming random variables by multiplying or adding! There are three different problems with multiple pieces of information to find for each. I use these as warm ups, exit tickets or homework. As students type in the correct answer, a piece of the pixel image appears, providing them with instant feedback and instant student
Subjects:
Grades:
9th - 12th
Types:
CCSS:
Also included in: AP Stats Digital Activities for all chapters!
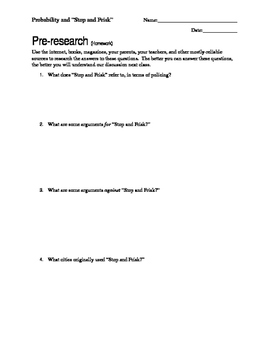
Using Probability to Teach Social Justice
This is an exploratory experiment/activity about basic probability. Students discover the differences between theoretical probability, experimental probability, and reality by taking a hard look at Stop and Frisk in urban areas. Students also deal with independent and dependent events.
By the end of the project, students will be able to:
Articulate the differences between theoretical and experimental probability through prediction and experimentation.
Articulate the differences between indep
Subjects:
Grades:
8th - 12th
Types:
CCSS:
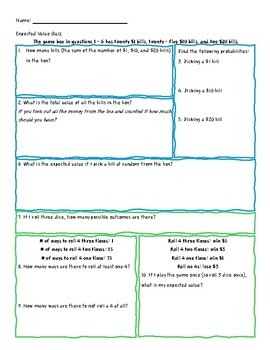
Expected Value Quiz
This is a quiz to assess students' understanding of expected value.One problem involves picking a bill out of a box. Students must know the difference between the objects and the weights and how to use both to find the expected value.The other problem concerns the outcomes of rolling three dice at once. Students need to know how to find the total number of possible outcomes, use the weights, and use the complement to find the expected value of the game. The two problems are broken down into smal
Subjects:
Grades:
11th - 12th, Higher Education
Types:
CCSS:
AP Statistics Holiday Themed Probability Practice
This is a great resource to help students review various AP Statistics probability topics. The questions cover:basic probability rulesthe general addition rulethe general multiplication ruleVenn diagramstree diagramsconditional probabilitybinomial and geometric probabilitiesNormal model probabilitiesthe use of random variables and probability modelsAll questions are holiday themed and solutions are included!
Subjects:
Grades:
10th - 12th, Higher Education
Types:
CCSS:
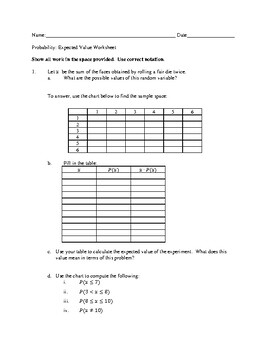
Expected Value Worksheet with Answer Key
This 7-question worksheet asks students to find expected values and discuss it in the context of the problem. There are questions about dice, insurance policies, cards, and manufacturing plans. Students must also think about cost versus profit when determining expected value.I use this worksheet alternatively as a homework and as a quiz in my Probability and Statistics class.
Subjects:
Grades:
8th - 12th, Higher Education
Types:
CCSS:
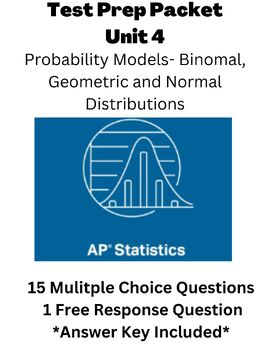
AP Statistics- Probability Models: Geometric, Binomial and Normal Distributions
**All questions in this document are NEW and solutions cannot be googled**(as of this post on 6/6/23)Test-prep practice directly aligned to College Board's CED for AP Statistics. This packet contains 15 multiple choice questions and 1 free response question, in addition to an answer key. The content covered spans across the use of probability models including geometric, binomial and normal distributions. The download is an editable word document.This document would be great to use as review for
Subjects:
Grades:
9th - 12th
Types:
CCSS:
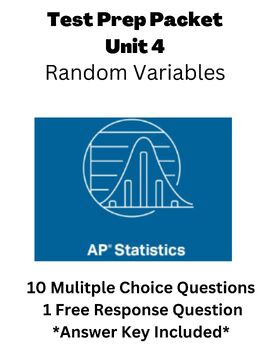
AP Statistics- Discrete and Continuous Random Variable Practice
**All questions in this document are NEW and solutions cannot be googled**(as of this post on 6/6/23)Test-prep practice directly aligned to College Board's CED for AP Statistics. This packet contains 10 multiple choice questions and 1 free response question, in addition to an answer key. The content covered in this packet includes practice on discrete and continuous random variables, with focus on finding expecting values, standard deviation, combining variables, transforming variables, and usin
Subjects:
Grades:
9th - 12th
Types:
CCSS:
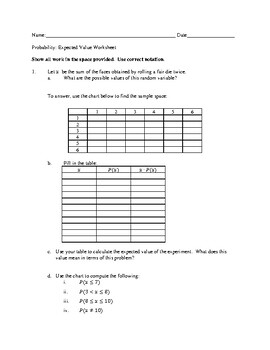
Expected Value Worksheet
This 7-question worksheet asks students to find expected values and discuss it in the context of the problem. There are questions about dice, insurance policies, cards, and manufacturing plans. Students must also think about cost versus profit when determining expected value.I use this worksheet alternatively as a homework and as a quiz in my Probability and Statistics class.If you would like to purchase this resource with the answer key attached, see:Expected Value Worksheet with Answer Key
Subjects:
Grades:
8th - 12th, Higher Education
Types:
CCSS:
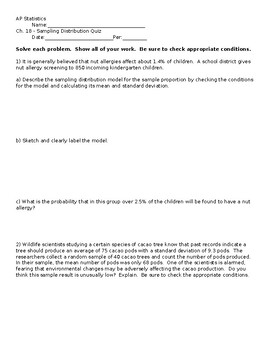
Sampling Distribution Quiz (version C)
This quiz assesses students' ability to create and work with sampling distributions for both proportions and means. Students will be asked to check conditions for using the CLT, draw and label sampling distributions, and compute normal probabilities from their sampling distributions. There is 1 version of the quiz with theanswer key attached. AP Statistics Unit 5: Sampling Distributions
Subjects:
Grades:
10th - 12th
Types:
CCSS:
Probability Distributions PowerPoint: Discrete, Binomial, Geometric, Poisson
This 30-slide PowerPoint walks students through the basics of:discrete probability distributionsfinding the mean, variance, and standard deviation of a discrete probability distributionbinomial distributions using the formulabinomial distributions using the binomial distribution chartexpected valuefinding the mean, variance, and standard deviation of a binomial distributionthe geometric distribution, including an examplethe Poisson distribution, including an example
Subjects:
Grades:
9th - 12th, Higher Education
CCSS:
Also included in: Probability and Statistics PowerPoints
Showing 1-24 of 74 results

