4 results
Graphing Common Core HSA-REI.A.1 projects

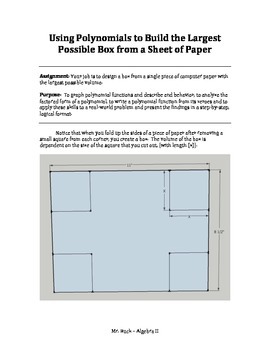
Algebra 2 Polynomials Activity and Lab - Using Polynomials STEM Poster Project
This 2-3 day math project gets students thinking about polynomials in the real world. Students design a box from a sheet of paper with the purpose of maximizing the volume and then display the entire mathematical process on a poster. Students add graphs, a model of the box and explain the entire mathematical process in a logical and sequential order. This project gets students working in groups, discussing ideas and writing about the process they take to solve a problem. Many find the poster
Subjects:
Grades:
10th - 12th, Higher Education
Types:
CCSS:

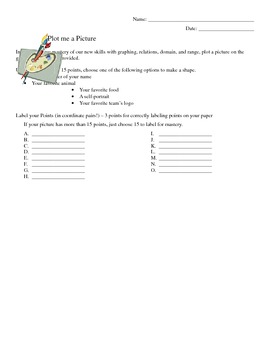
Plot Me a Picture - Function, Domain, Range. and Plotting Practice
In order to review the coordinate plane and practice relation, domain, range, and functions, I created this mini-project.
After introducing the new terms and modeling a small example problem, I gave each student the assignment sheet and a blank piece of graph paper. Over two class periods, they were responsible for creating a finished plotted picture, have 15 ordered pairs labeled, have written the relation, domain, and range.
Students really enjoyed the opportunity to be creative and the voc
Grades:
7th - 10th
Types:
CCSS:

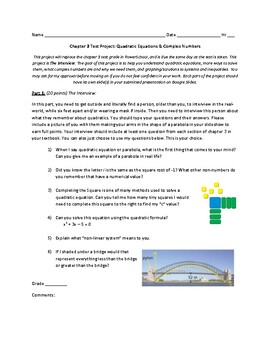
PBL for Quadratic Equations & Complex Numbers
Project to help students understand quadratic equations, and how to solve them using completing the square, quadratic formula, and graphing. Also, understanding complex numbers, non-linear systems, and quadratic inequalities.
Subjects:
Grades:
9th - 12th
Types:
CCSS:

Linear Curve Fitting - Semiconductor Prices versus Year
Many real-world phenomena follow a linear relationship over time. In this activity, you’ll examine one such example, the Product Price Index (PPI) for Semiconductors (computer chips) from 1993 through 2013, by plotting data, drawing a linear curve fit, finding the equation of the fit line, and answering some questions.
Subjects:
Grades:
9th - 12th
Types:
CCSS:
Showing 1-4 of 4 results


