11 results
High school graphing center interactive whiteboards
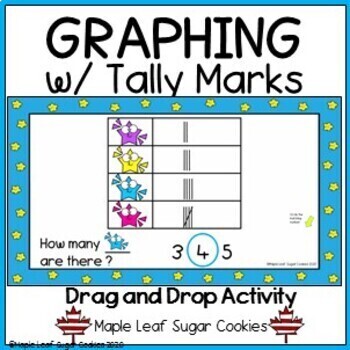
Graphing w/ Tally Marks - Data Management Graphs - Google Slides
Teach graphing and tally marks with this colourful and fun activity. Follow the prompts on each page to identify the number of items in the graphs. Children can drag the circles to the corresponding numbers in order to demonstrate knowledge of counting up tally marks in a graph. Interactive way to teach math skills. Great for interactive whiteboards, whole class lessons, math centres, assessment and Google Classroom.Newly revised: The final few slides have a "Match the Number to the Tally Mark"
Statistics Activity
This powerful activity focuses on using the TI 84+ calculator to calculate the mean, median, range, z-score, standard deviation, mean absolute deviation, permutations, combinations, and probabilities with normal distribution. You will also gain insight on how to create multiple box and whisker plots on one graph.
This is aligned to the Common Core and VA SOLs A.9, A.10, AII.11, and AII.12.
Subjects:
Grades:
7th - 12th
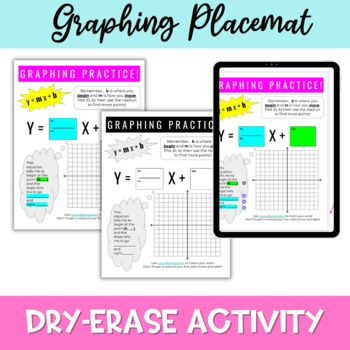
Graphing Linear Functions Practice Activity Digital and Printable
This product contains a printable placemat for students to use as they practice their graphing skills from slope-intercept form.Included:Printable placemat: Color and Black/White versions to meet your needs.Digital placemat for computer use.Written suggestions for easily and effectively using and prepping your placemats for classroom use.
Subjects:
Grades:
7th - 9th
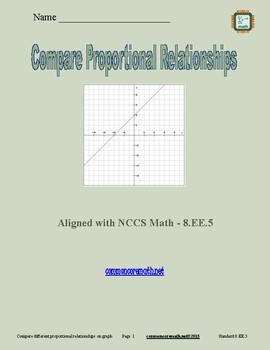
Compare Proportional Relationships - 8.EE.5
Graph proportional relationships and interpret the unit rate as the slope of the graph. Compare two different proportional relationships represented in different ways. Scaffolded lesson provides for classroom differentiation. Can be used as a lesson leader, guided practice, independent practice, for cooperative learning and math centers, or as an assessment. Use with smartboard, projector, computer, pad or as printable. Lesson is complete - NO PREP. Editable version included.
Objectives:
- Comp
Grades:
7th - 9th
CCSS:

Ultimate Algebra for Windows PC (Full)
Ultimate Algebra for Windows PC (Full Version)
Note: This Full Version comes zipped with the Simple User Guide
Ultimate Algebra was developed as a simple, easy to use and functional tool to be incorporated either into the classroom or at home. Ultimate Algebra is a highly visual learning resource and is intended to engage learners and help them develop both their understanding of algebra and build up their confidence in regard to problem solving.
Ultimate Algebra is a question resource t
Grades:
8th - 12th, Higher Education, Adult Education
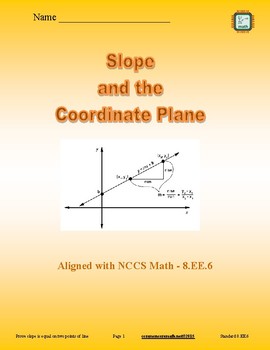
Slope and the Coordinate Plane - 8.EE.6
Explore slope through lines on the coordinate planes, formulas, and triangles. Scaffolded lesson provides for classroom differentiation. Can be used as a lesson leader, guided practice, independent practice, for cooperative learning and math centers, or as an assessment. Use with smartboard, projector, computer, pad or as printable. Lesson is complete - NO PREP. Editable version included.
Objectives:
- Determine slope of non-verticle lines on the coordinate plane
- Write equations for graphed l
Grades:
7th - 9th
CCSS:
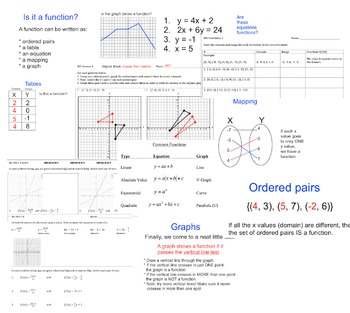
Complete presentation - Functions, inverses
This is a complete, 43 slide SMART Board presentation on functions. Teachers can walk though slide by slide, asking questions along the way to discover many different ways we can write and represent functions: ordered pairs, mapping, equations, graphing, etc.Teachers can print out activities on functions / inverses.1) Is it a function? Students look at domain and range to determine if sets of numbers are functions or not. Then they plot points to see if sets of ordered pairs pass the 'vertical l
Subjects:
Grades:
7th - 10th
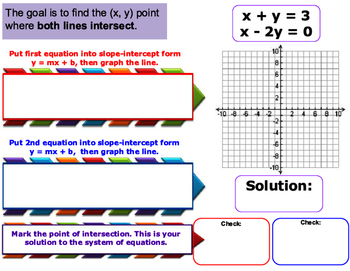
Solving Systems by Graphing with Answers
These can be printed on card stock on both sides (one side the problem, one side the answer). I included a problem with no solution, and a problem with infinitly many solutions. Good enrichment activity. Can also be used on the an interactive whiteboard.
Grades:
8th - 12th, Adult Education

One Variable inequalities and graphing
Smartboard lesson about one variable inequalities, x=1, x>2, x<4... What do they mean and how do we graph them. There are short lessons attached with interactive student lessons in between. I do, we do, you do is the format of this Smartboard lesson. Also, attached are two worksheets with the answers attached ideal for silent work or group work to test their understanding.
Subjects:
Grades:
6th - 9th
Systems Activity
This dynamic activity provides students with a graphical approach to systems. Systems of Linear, non-linear and inequalities.
Calculator steps are for the Common Core and VA SOLS A.4, A.5, and AII.5 using the TI 84+ graphing calculator.
Subjects:
Grades:
7th - 12th

Numerical methods: interval bisection, linear interpolation, Newton-Raphson
This is a short teacher's guide to the numerical methods resources available at mavisresources.com
These are free, online, animated resources for teaching advanced maths on the interactive whiteboard.
Subjects:
Grades:
10th - 12th
Showing 1-11 of 11 results


