2 results
Common Core 2.MD.D.10 activities for Microsoft Excel

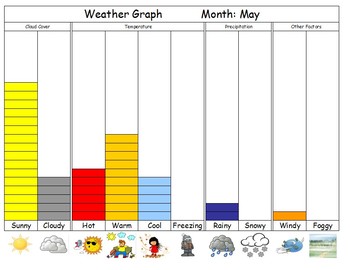
FREE Editable Monthly Weather Graph
I use this excel sheet to graph the weather each day. Simply copy the rectangle under the weather, and paste it in its column to form a bar graph. Every month, save and print the weather, then start fresh with a new sheet. You can then compare weather in September to weather in January to weather in April. Make sure page layout is landscape and margins are set to "narrow" before printing!
I project this excel sheet onto our smartboard, so that the students can see the data and count/analyze as
Subjects:
Grades:
PreK - 2nd

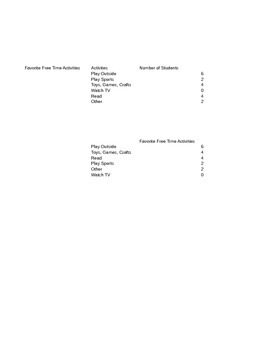
Favorite Hobby/Free Time Real-Time Interactive Bar and Pie Graph
Take a live poll and show your students how the data input changes the bar and pie graph. Easily modified to fit many classrooms by simply changing the names of the hobbies or change the topic altogether.
Subjects:
Grades:
K - 3rd
Showing 1-2 of 2 results

