4 results
10th grade engineering activities for Microsoft Excel

Google Sheets - Creating Charts with live Weather data! FUN Technology Lesson!
A fun, ready-to-go EDITABLE lesson!Students collect online weather data, bring it into a spreadsheet and then CREATE CHARTS and interpret the data!Including:A Lesson PlanA presentationSpreadsheet template Completed example spreadsheetVIDEO SCREENCAST - Showing how to complete the activity!Check out the preview and video preview!My students have enjoyed this class and yours will too. It's all here ready for you!===============================Please leave feedback and respect copyright, purchase a
Grades:
4th - 12th, Adult Education
Types:

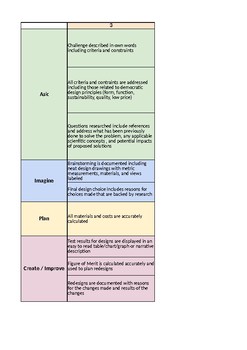
STEM / STEAM / Engineering Design Brief Rubric
Use to score the completion of the Design Brief Template. Includes self, peer, and teacher scoring columns and descriptions for each level of performance. For added clarity, the rubric is color coded to match each section of the template.
Subjects:
Grades:
6th - 12th
Types:

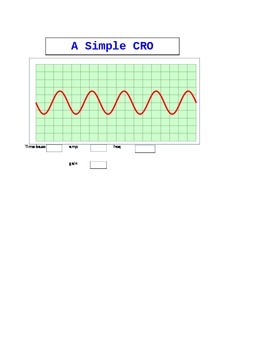
CRO (Cathode Ray Oscilloscope) Simulation
This simple simulation of CRO (Cathode Ray Oscilloscope) can help students understand better the effect of adjusting gain setting and time-base setting of the CRO on the waveform (traces) shown on the screen.
Subjects:
Grades:
8th - 12th
Types:

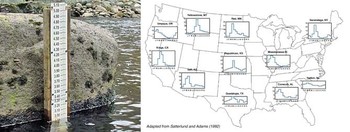
Flood Analysis
Students learn how to use and graph real-world stream gage data to create event and annual hydrographs and calculate flood frequency statistics. Using an Excel spreadsheet of real-world event, annual and peak streamflow data, they manipulate the data (converting units, sorting, ranking, plotting), solve problems using equations, and calculate return periods and probabilities. Prompted by worksheet questions, they analyze the runoff data as engineers would. Students learn how hydrographs help eng
Subjects:
Grades:
10th - 12th
Types:
Showing 1-4 of 4 results


