8 results
Common Core 8.SP.A.1 activities for Easel Activities
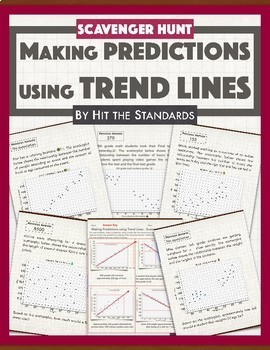
Predictions from Scatterplots using Trend Lines (best fit) -SCAVENGER HUNT
This Making Predictions using Trend Lines Scavenger Hunt is an excellent activity for students to practice working with scatter plots, lines of best fit, graphing, and the best part is that they get to move around the classroom looking for the next problem to solve! Directions: Print the 10 problems and scatter them around the room .Give one student worksheet to each student, place them in groups of 2 or 3 and assign a problem to each group. Students must make predictions for each problem using
Subjects:
Grades:
8th - 9th
Types:
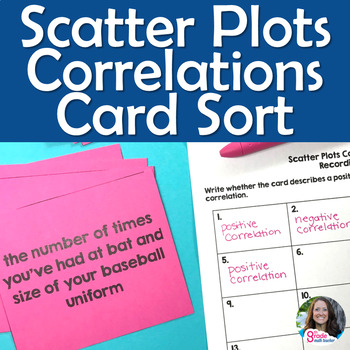
Scatter Plots Correlation Association Card Sort Activity or Task Cards
Get your students thinking with this scatter plots activity! This resource has 32 cards for students to investigate patterns of association (correlations) between two quantities (plus 4 blank cards). Use these as a card sort or task cards.Card sort: Students work in pairs or groups to sort the cards into 3 piles (positive association, negative association, or no association). As they sort, they give their reasoning why each card goes into the particular pile.Task cards: Students can work individ
Subjects:
Grades:
8th
Types:
CCSS:
Line of Best Fit Practice Worksheet
Hello Math Teachers! Are you looking for a fun and engaging way for your students to practice their scatterplot skills? Check out this worksheet that focuses on eyeballing the line of best fit and estimating the correct equation that corresponds with it.With this two-sided worksheet, students will have the opportunity to practice using scatterplots and make the connection to the fit of a linear function. The scaffolding includes matching equations to the line of best fit (regression line), which
Subjects:
Grades:
8th
Types:
CCSS:
Also included in: Scatterplots Two Way Tables and Residual Plots Worksheets Bundle
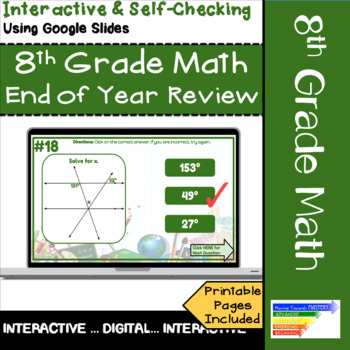
8th Grade Math End of Year Review Activity Digital & Printable Test Prep
Time to review the 8th grade math standards! Whether preparing for state testing or you just need a good end of year review, challenge your students with an engaging digital self-checking assignment designed for Google Slides. Hold your students accountable with the printable worksheet included.These self-checking slides are intended for reviewing 8th grade math common core standards students have learned throughout the year. When students choose an incorrect answer, they will be directed to try
Subjects:
Grades:
8th
Types:
Also included in: 8th Grade Math Common Core Growing Bundle
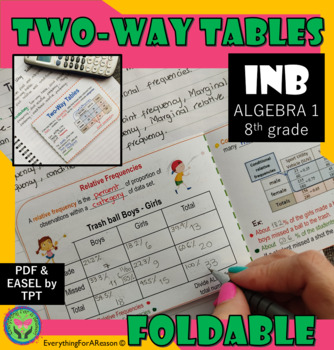
Two-way Tables - relative and conditional frequencies FOLDABLE
Teaching how to find and interpret marginal frequencies can be tricky! so, grab this easy and fun foldable/ graphic organizer to help your students learn to make two-way tables. These are interactive notes perfect for your math journals or interactive notebooks. Playing trash ball with your students can help you to teach the vocabulary: joint frequency, marginal frequencies, relative frequencies, and conditional relative frequency. Suitable for Algebra 1 students, grade 8th and grade 9th.This m
Subjects:
Grades:
8th - 10th
CCSS:
Also included in: 8th Grade Math Interactive Notebook All-Year Curriculum PDF + EASEL
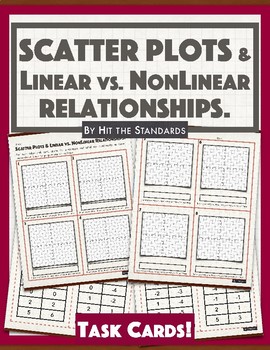
Scatter Plots: Comparing Linear vs. NonLinear Relationships Task Cards
In this Scatter plots & Linear vs. NonLinear Relationships, students will use data tables given on task cards to graph scatter plots and label each relationship as linear proportional, linear not proportional or not linear. There are 8 task cards with problems in total. I prefer to do this activity ion groups of 3 or 4, place the task cards in the center of the table and ask them to get one (order doesn’t matter),solve it, put the card back, get another one and repeat until all 8 problems ar
Subjects:
Grades:
7th - 9th
Types:
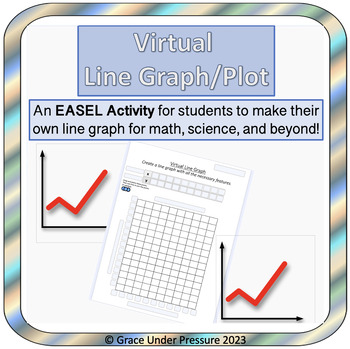
Virtual Line Graph or Scatter Plot Template: EASEL ONLY
This product is a virtual (EASEL) line graph or scatter plot template that can be used for graphing data from math, science, social studies, psychology, or other subjects.You can type in the ordered pairs ahead of time, or you can have your students type them into the (x,y) chart. Then, they have to use the ordered pairs to make a line graph or scatter plot:• Type in a title• Label x & y axis• Choose an appropriate scale and enter it on each axis• Drag and drop the circles as data points• Us
Subjects:
Grades:
Not Grade Specific
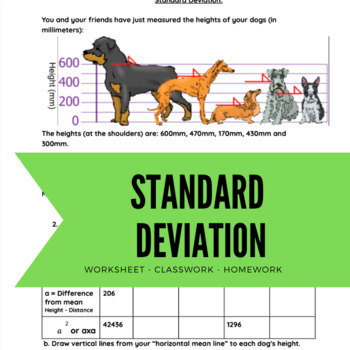
Standard Deviation, Variance, and mean practice worksheet and guided notes.
Standard deviation, variance, and mean worksheet. Perfect for class work or homework. Working with 5 data points for easy computations.
Subjects:
Grades:
6th - 12th
Types:
CCSS:
Showing 1-8 of 8 results

