Writing Linear Equations: Linear Function Art Project
Algebra Simplified
850 Followers
Algebra Simplified
850 Followers
What educators are saying
Guided activity that we completed together as a class before having students to complete their own picture
These we great projects for my 8th grade pull-out math class. Students were able to show their understanding of linear functions in the form of an art project.
Description
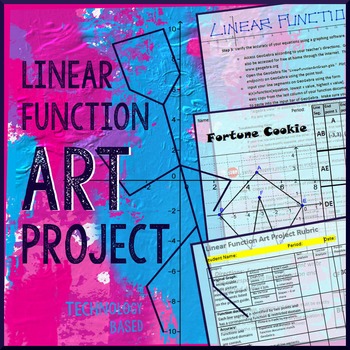
Linear Functions & ART? Gasp as creativity flows out of students in this synthesis level project. Revel in the algebra objectives met simultaneously. Reinforce understanding of writing linear equations with this Writing Linear Function Art Project. Students create a unique design with only line segments and then write the linear functions with restricted domains to recreate the picture. The accuracy of slopes, y-intercepts, and domains is immediately evident as functions are graphed with a free robust graphing software called GeoGebra. Graphing linear equations with restricted domains by hand is also a part of the project.
What I’m not selling:
The Idea: Writing functions and restricting domains to build a picture is no new concept. It’s new to you? The basic idea is delineated above. Why not have a go at it?
The Technology: GeoGebra is free openware software. Check it out --geogebra.org You will love it!
So what am I selling?
►Experience driven project criteria
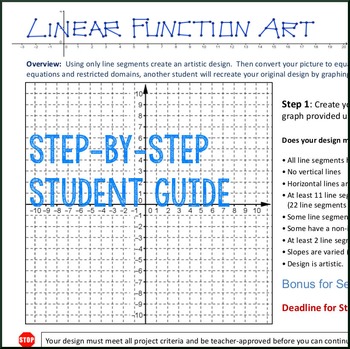
►A step-by-step digital student guide
►An extensive teacher guide (7 pages)
►A project exemplar for student/teacher reference
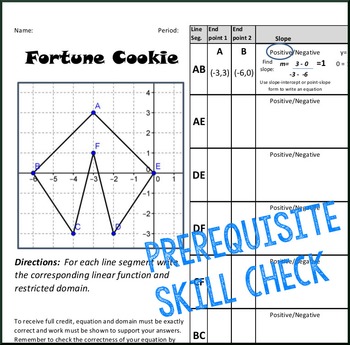
►A pre-project skill check worksheet with answer key
►A vetted project rubric
☝Check out the Preview.
This project requires the use of technology. GeoGebra, free graphing software, is highly suggested, although other graphing software I'm sure would work. The technology aspect of this project gives students immediate feedback on the accuracy of their equations and is CRITICAL to the success of this project. If you can get access to a 1 computer: 2 student set-up (with internet access) for at least three days, this project can work for you.
Please note the download is a .zip file. Within the .zip file you will find .docx files, .pdf files, and a .ggb file. To open the .ggb file, you must first download the FREE web-based graphing software called GeoGebra from GeoGebra.org. More instructions can be found in the teacher guide. If you would like to check out GeoGeobra before purchasing, the link is geogebra.org.
❤ Why I love this project: ❤
❶ A new wave of students always swells to the top through this project.
❷ Troubleshooting incorrect equations really hits home the effect slope, y-intercept, and domain have on the graph of a line.
❸ Students have this sense of pride and accomplishment in their finished projects. Moreover, finished projects can really be used (see teacher guide for more).
❹ Showing off these projects to others is super fun!
Teacher tested; student approved.
Algebra Simplified
__________________________________________________________________________
Need more of a basic approach for a reasonable price? Check out this simple, self-checking, Linear Functions Graph to Equations Multiple Choice Worksheet. __________________________________________________________________________
algebra, writing linear equations, writing linear functions, restricted domains, writing linear functions given two points, writing linear equations given two points, slope-intercept form
± All feedback is valued and encourages improved products. Did you know buyers also have access to future revisions?
Thumbnail: Gimp2, KG All of Me font, Sparkling Tea Arrows
Total Pages
21 pages
Answer Key
Included with rubric
Teaching Duration
4 days
Report this resource to TPT
Reported resources will be reviewed by our team. Report this resource to let us know if this resource violates TPT’s content guidelines.
Standards
to see state-specific standards (only available in the US).
CCSS8.F.B.4
Construct a function to model a linear relationship between two quantities. Determine the rate of change and initial value of the function from a description of a relationship or from two (𝘹, 𝘺) values, including reading these from a table or from a graph. Interpret the rate of change and initial value of a linear function in terms of the situation it models, and in terms of its graph or a table of values.
CCSSHSA-CED.A.2
Create equations in two or more variables to represent relationships between quantities; graph equations on coordinate axes with labels and scales.


