
Weather Recording Tracker Log or Journal Science Activity


- PDF
What educators are saying
Also included in
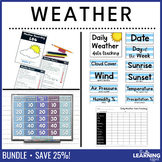 Your students will love being meteorologists while tracking the weather during your science unit! At the end, review with a fun Jeopardy-style game show! This bundle includes a whole class weather tracking chart, student weather recording log booklet, and game show.Save 25% by purchasing three WeathPrice $7.50Original Price $10.00Save $2.50
Description
Do your science standards require students to observe, record, and make predictions about the weather? This weather recording log was created to assess these standards and be used as a culminating activity at the end of a weather unit. Use it as a homework assignment or have students complete a page in class each day.
⭐ BUNDLE & SAVE ⭐
Save 25% by purchasing this resource in a bundle with two other weather resources
THIS RESOURCE INCLUDES
- Weather Recording Log cover page
- Weather recording pages for days 1-10 include the following:
- Date
- Time
- Location
- Temperature
- Thermometer clip art - students label & color the image to show temperature
- How would you describe today's weather?
- Weather conditions (circle those that are present)
- Suggested clothing for today would be...
- What do you predict the weather will be like tomorrow?
- Unnumbered page for recording weather conditions
- All pages are ink-saving black and white
INCLUDED FILE FORMAT
- PDF: This resource requires Adobe Reader (free software). The contents may not show correctly if using other PDF software.
PLEASE NOTE
⚠️ This resource is NOT editable in any way, and you will not be able to manipulate the content inside.
CLICK HERE to follow The Learning Effect and be the first to know when NEW resources are added to my store!
New resources are always discounted for the first 48 hours.
CONNECT WITH ME
The Learning Effect Blog • Instagram • Facebook • Email Sign Up
Please ask ALL questions before purchasing.
© The Learning Effect, LLC | Tiffany Schmidt
All rights reserved by author.
Permission to copy for single classroom use only.
Please purchase additional licenses at a discounted rate for additional users.
Intended for classroom and personal use only.
