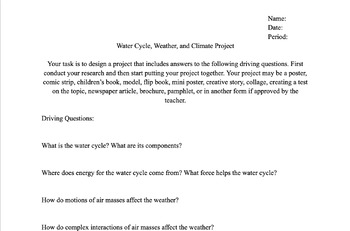
Water Cycle, Weather, and Climate Project
Sydney Murray
0 Followers
Grade Levels
6th - 9th
Subjects
Standards
NGSSMS-ESS3-1
NGSSMS-ESS3-5
NGSSMS-ESS2-4
NGSSMS-ESS2-6
NGSSMS-ESS2-5
Formats Included
- Google Docs™
Sydney Murray
0 Followers

Made for Google Drive™
This resource can be used by students on Google Drive or Google Classroom. To access this resource, you’ll need to allow TPT to add it to your Google Drive. See our FAQ and Privacy Policy for more information.
Description
This is a student lead research project. Students research the water cycle, weather, and climate. Students conduct their research and then choose how they would like to demonstrate their learning. Rubric is included. Great for sub plans too!
Total Pages
Answer Key
N/A
Teaching Duration
N/A
Report this resource to TPT
Reported resources will be reviewed by our team. Report this resource to let us know if this resource violates TPT’s content guidelines.
Standards
to see state-specific standards (only available in the US).
NGSSMS-ESS3-1
Construct a scientific explanation based on evidence for how the uneven distributions of Earth’s mineral, energy, and groundwater resources are the result of past and current geoscience processes. Emphasis is on how these resources are limited and typically non-renewable, and how their distributions are significantly changing as a result of removal by humans. Examples of uneven distributions of resources as a result of past processes include but are not limited to petroleum (locations of the burial of organic marine sediments and subsequent geologic traps), metal ores (locations of past volcanic and hydrothermal activity associated with subduction zones), and soil (locations of active weathering and/or deposition of rock).
NGSSMS-ESS3-5
Ask questions to clarify evidence of the factors that have caused the rise in global temperatures over the past century. Examples of factors include human activities (such as fossil fuel combustion, cement production, and agricultural activity) and natural processes (such as changes in incoming solar radiation or volcanic activity). Examples of evidence can include tables, graphs, and maps of global and regional temperatures, atmospheric levels of gases such as carbon dioxide and methane, and the rates of human activities. Emphasis is on the major role that human activities play in causing the rise in global temperatures.
NGSSMS-ESS2-4
Develop a model to describe the cycling of water through Earth’s systems driven by energy from the sun and the force of gravity. Emphasis is on the ways water changes its state as it moves through the multiple pathways of the hydrologic cycle. Examples of models can be conceptual or physical. A quantitative understanding of the latent heats of vaporization and fusion is not assessed.
NGSSMS-ESS2-6
Develop and use a model to describe how unequal heating and rotation of the Earth cause patterns of atmospheric and oceanic circulation that determine regional climates. Emphasis is on how patterns vary by latitude, altitude, and geographic land distribution. Emphasis of atmospheric circulation is on the sunlight-driven latitudinal banding, the Coriolis effect, and resulting prevailing winds; emphasis of ocean circulation is on the transfer of heat by the global ocean convection cycle, which is constrained by the Coriolis effect and the outlines of continents. Examples of models can be diagrams, maps and globes, or digital representations. Assessment does not include the dynamics of the Coriolis effect.
NGSSMS-ESS2-5
Collect data to provide evidence for how the motions and complex interactions of air masses result in changes in weather conditions. Emphasis is on how air masses flow from regions of high pressure to low pressure, causing weather (defined by temperature, pressure, humidity, precipitation, and wind) at a fixed location to change over time, and how sudden changes in weather can result when different air masses collide. Emphasis is on how weather can be predicted within probabilistic ranges. Examples of data can be provided to students (such as weather maps, diagrams, and visualizations) or obtained through laboratory experiments (such as with condensation). Assessment does not include recalling the names of cloud types or weather symbols used on weather maps or the reported diagrams from weather stations.


