Regents Physics Resources - New York State
13 Followers
Description
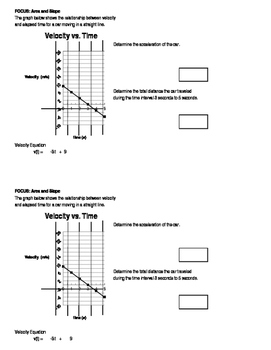
This is a daily do now that generates and randomizes the numbers for interpreting velocity vs. time graphs that have constant acceleration. It asks for the acceleration of the car and the distance covered in a time interval. You can make an infinite number of problems with the file due to the randomization. Ideal for daily warm ups and quizzing students on skills aligned to standards.
I focus on one skill a week. Every day they practice the skill at the beginning of class. At the end of the week I quiz them with the skill and they can retake the "quiz" as many times as needed. The randomization of the numbers and words makes planning and copying easy and helps prevent cheating. Grading is easy too as an original answer key is provided for each randomization.
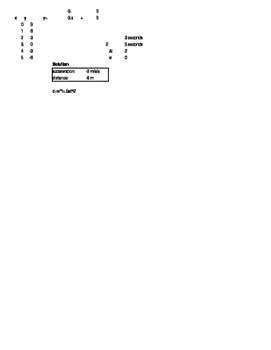
To randomize, click an empty cell (with no writing in it) and hit "delete" or F9. The numbers will change in addition to the slope of the graph. The solution will also change to match the new numbers.
Total Pages
2 pages
Answer Key
Included
Teaching Duration
Other
Report this resource to TPT
Reported resources will be reviewed by our team. Report this resource to let us know if this resource violates TPT’s content guidelines.


