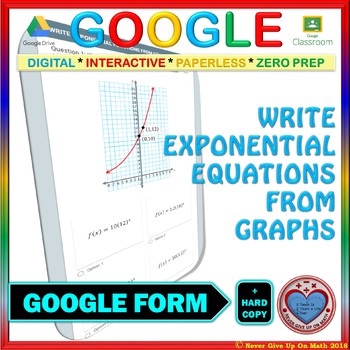
Use with Google Forms: Write Equation of Exponential Function from Graphs
- PDF
- Google Apps™

Also included in
- This bundle includes a total of 60 INTERACTIVE ACTIVITIES. These are the TOP 20 Algebra I Activities sold at my store as well as TOP 40 Algebra I Activities. These activities are Paperless, zero prep, interactive, and very engaging. Many of these activities are self-checking as well. Each of thesePrice $154.24Original Price $192.80Save $38.56
- This is VOLUME 2 a ❤PRICELESS❤ "DIGITAL" Bundle. ☑ VOLUME 1 is found here.These MEGA bundles (more to come) will contain all of the digital activities at my store.Suggested Ways to use the ACTIVITIES of this bundle are❤ Assign as a homework❤ Assign as a review before an assessment❤ Assign on one-sesPrice $399.00Original Price $636.84Save $237.84
Description
✐ This 12 questions (MULTIPLE CHOICE) product is a NO PREP & SELF GRADING 100% EDITABLE (EXCEPT FOR THE IMAGES) activity that will assess students in understanding how to Write an Equation of Exponential Functions from Graphs.
In this activity, students will work with these graphs:
☑ Exponential Growth where initial value is provided in addition to next point on the graph (6 Questions)
☑ Exponential Decay where initial value is provided in addition to next point on the graph (6 Questions)
Please note that students will only and only be working with GRAPH where the initial value is always given.
I use this Google Form as:
☑ Recap
☑ Warm up (Entrance Ticket)
☑ Quiz ( Individual Practice)
☑ Exit Ticket
☑ Homework
☑ Center Activity (for differentiation)
☑ .... & as you wish
Students should feel comfortable:
☑ Identify the initial value "a" of the graph where (0, a) is given
☑ Using the given point to find "b"
My Algebra I students have appreciated this quick quiz as it helped them focus only and only on charts and feel confident in deciphering the information provided in the chart & use it to determine the type of the function.
An Optional Hard Copy is included in this product.
A Suggested Step-By-Step Answer Key is included in this product.
Please take a look at the preview and see the questions of this Google Form before purchasing
FOLLOW ME FOR MORE GOOGLE FORMS ON THIS TOPIC & OTHER TOPICS
☺Would love to hear your feedback☺. Please don't forget to come back and rate this product when you have a chance. You will also earn TPT credits. Enjoy and I ☺Thank You☺ for visiting my ☺Never Give Up On Math☺ store!!!
© Never Give Up On Math 2019
This product is intended for personal use in one classroom only. For use in multiple classrooms, please purchase additional licenses.
☺ HAVE A WONDERFUL DAY ☺


