
Types of Slope and Linear Equation Math Posters


The Positive Math Classroom by Amy Hearne
2.3k Followers
The Positive Math Classroom by Amy Hearne
2.3k Followers
Also included in
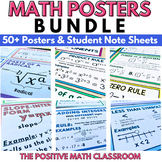 Your middle school math students will love these posters that include clear and easy-to-read step-by-step examples. Not only are these posters colorful and make a great reference all year long, they include important math topics such as square roots, exponents, integer rules, linear equations, and sPrice $16.00Original Price $22.25Save $6.25
 This bundle of resources is a perfect way to teach your students all about slope and graphing linear equations. Included are engaging and easy-to-use materials such as guided notes, task cards, posters, and a project. You will save 30% by purchasing this bundle instead of each resource individuallyPrice $18.75Original Price $26.75Save $8.00
Description
These easy-to-read and colorful posters will be a perfect addition to your lessons on types of slope, slope formulas, and linear equations. Print and go with these posters that will be a helpful student reference either for a review, unit, or all year long.
Included are 23 posters in both color and printer-friendly versions that cover the following skills:
- Ordered Pairs
- Coordinate Plane
- Linear vs. Non-Linear Equations
- Slope
- Types of Slope
- Slope Formula
- x-intercepts and y-intercepts
- Standard Form
- Slope-Intercept Form
- Point-Slope Form
- Parallel and Perpendicular Lines
You may also be interested in these other math resources:
Slope-Intercept Graphing Art Activity
Follow me for updates on new products that are always 50% off for the first 24 hours.
Total Pages
40+
Answer Key
N/A
Teaching Duration
N/A
Report this resource to TPT
Reported resources will be reviewed by our team. Report this resource to let us know if this resource violates TPT’s content guidelines.
Standards
to see state-specific standards (only available in the US).
CCSS8.F.A.3
Interpret the equation 𝘺 = 𝘮𝘹 + 𝘣 as defining a linear function, whose graph is a straight line; give examples of functions that are not linear. For example, the function 𝘈 = 𝑠² giving the area of a square as a function of its side length is not linear because its graph contains the points (1,1), (2,4) and (3,9), which are not on a straight line.
CCSS8.F.B.4
Construct a function to model a linear relationship between two quantities. Determine the rate of change and initial value of the function from a description of a relationship or from two (𝘹, 𝘺) values, including reading these from a table or from a graph. Interpret the rate of change and initial value of a linear function in terms of the situation it models, and in terms of its graph or a table of values.
CCSS8.F.B.5
Describe qualitatively the functional relationship between two quantities by analyzing a graph (e.g., where the function is increasing or decreasing, linear or nonlinear). Sketch a graph that exhibits the qualitative features of a function that has been described verbally.
Reviews
Questions & Answers
2.3k Followers
