TPT
Total:
$0.00

Two Way Relative Frequency Tables Guided Notes Practice HW 8th Grade Math

;
Grade Levels
7th - 9th
Resource Type
Standards
Formats Included
  • Zip
  • Google Apps™
  • Microsoft OneDrive
Pages
9 pages + 9 Slides each in Google/PowerPoint
$4.00
$4.00
Share this resource
Report this resource to TPT
Includes Google Apps™
The Teacher-Author indicated this resource includes assets from Google Workspace (e.g. docs, slides, etc.).
Also included in
  1. Are you looking for an entire 8th-grade math Curriculum with warm-ups, guided notes, practice worksheets, homework, and editable assessments? Look no further than this 8th-grade math GROWING curriculum full-year bundle. The following 8th-grade Math Curriculum is wholly aligned with Common Core St
    Price $180.00Original Price $225.00Save $45.00
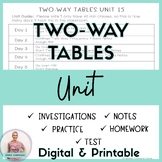
  2. This Two Way Tables Bundle is everything you need to teach your middle school math students about two-way frequency tables to understand that patterns of association can be seen in bivariate categorical data by displaying frequencies and relative frequencies in a two-way table. ✅ Includes:Investigat
    Price $7.60Original Price $9.50Save $1.90
  3. Are you looking for an entire 8th Grade Math Curriculum with guided notes, activities, AND editable assessments? Look no further than this 8th-grade math GROWING curriculum full year bundle. The following 8th-grade Math Curriculum is wholly aligned with Common Core State Standards for 8th grade i
    Price $292.80Original Price $366.00Save $73.20

Description

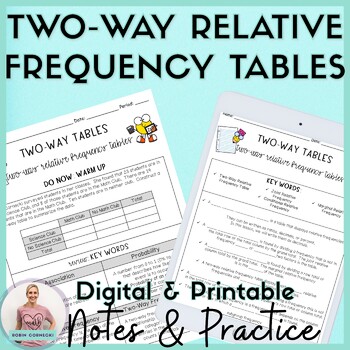
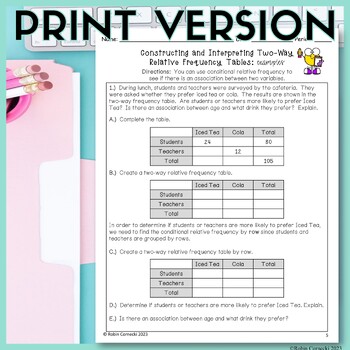
Two-Way Relative Frequency Tables Guided Notes is everything that you need to teach your middle school math students Constructing and Interpreting Two-Way Relative Frequency Tables. Students will also identify Joint Relative Frequency, Conditional Relative Frequency, and Marginal Relative Frequency through investigation and practice examples. These guided notes and practice worksheets are perfect for a binder or can be reduced in size to fit into an interactive notebook.

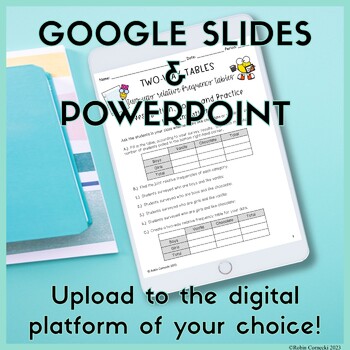
✅This resource is perfect for Distance Learning (zero prep) or in the classroom. It can be used with Google™ or Microsoft™. You will receive a pdf with the printables, a link to the Google slides, a PowerPoint version, and an answer key.

You must have a free Google™ account to access the Google™ slides.

These worksheets can be used digitally or in person with the provided pdf handouts included.

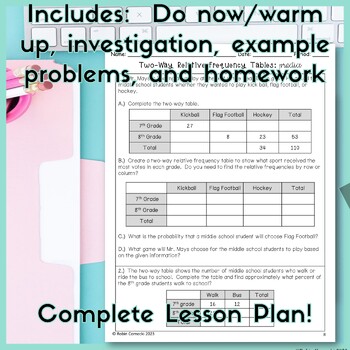
✅9 pages plus answer keys of notes and practice problems include: 

  • Optional Do Now/Warm Up

  • Investigation with guided notes and practice problems to do together in class and several "your turn" problems for students to do independently so you can check their understanding before you assign the homework.

  • 5 practice problems(with several parts) include a review of prior topics + a challenge question that can be used as in-class work, homework, or group work

✅ Plenty of room for your students to write down their answers and show their work!

✨This is my second lesson in my Two Way Tables Unit (coming soon)

You may also like:

Related Products

8th Grade Math Full Year Curriculum Growing Bundle

Two-Way Frequency Tables Guided Notes

Two-Way Relative Frequency Tables Guided Notes

Two Way Tables Bundle

Don't forget to leave a review to earn credit toward future resources at no extra cost!

Let's be social!

Follow Me on TpT

Blog

Facebook

Instagram

Pinterest

Newsletter

Total Pages
9 pages + 9 Slides each in Google/PowerPoint
Answer Key
Included
Teaching Duration
Lifelong tool
Report this resource to TPT
Reported resources will be reviewed by our team. Report this resource to let us know if this resource violates TPT’s content guidelines.

Standards

to see state-specific standards (only available in the US).
Understand that patterns of association can also be seen in bivariate categorical data by displaying frequencies and relative frequencies in a two-way table. Construct and interpret a two-way table summarizing data on two categorical variables collected from the same subjects. Use relative frequencies calculated for rows or columns to describe possible association between the two variables. For example, collect data from students in your class on whether or not they have a curfew on school nights and whether or not they have assigned chores at home. Is there evidence that those who have a curfew also tend to have chores?
Make sense of problems and persevere in solving them. Mathematically proficient students start by explaining to themselves the meaning of a problem and looking for entry points to its solution. They analyze givens, constraints, relationships, and goals. They make conjectures about the form and meaning of the solution and plan a solution pathway rather than simply jumping into a solution attempt. They consider analogous problems, and try special cases and simpler forms of the original problem in order to gain insight into its solution. They monitor and evaluate their progress and change course if necessary. Older students might, depending on the context of the problem, transform algebraic expressions or change the viewing window on their graphing calculator to get the information they need. Mathematically proficient students can explain correspondences between equations, verbal descriptions, tables, and graphs or draw diagrams of important features and relationships, graph data, and search for regularity or trends. Younger students might rely on using concrete objects or pictures to help conceptualize and solve a problem. Mathematically proficient students check their answers to problems using a different method, and they continually ask themselves, "Does this make sense?" They can understand the approaches of others to solving complex problems and identify correspondences between different approaches.
Model with mathematics. Mathematically proficient students can apply the mathematics they know to solve problems arising in everyday life, society, and the workplace. In early grades, this might be as simple as writing an addition equation to describe a situation. In middle grades, a student might apply proportional reasoning to plan a school event or analyze a problem in the community. By high school, a student might use geometry to solve a design problem or use a function to describe how one quantity of interest depends on another. Mathematically proficient students who can apply what they know are comfortable making assumptions and approximations to simplify a complicated situation, realizing that these may need revision later. They are able to identify important quantities in a practical situation and map their relationships using such tools as diagrams, two-way tables, graphs, flowcharts and formulas. They can analyze those relationships mathematically to draw conclusions. They routinely interpret their mathematical results in the context of the situation and reflect on whether the results make sense, possibly improving the model if it has not served its purpose.

Reviews

Questions & Answers