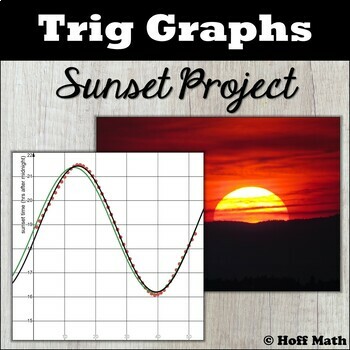
Trig Graphs Project | Sine Graph Sunset Project
- Zip
What educators are saying
Also included in
- This SLOW GROWING Bundle includes ALL of my Precalculus resources. As I create more resources, they will get added to this bundle. That means you get a discount on the resources already included (because you get the bundle discount) and then you can re-download to get any future resources for FREE!*Price $260.00Original Price $375.10Save $115.10
- This SLOW GROWING Bundle includes ALL of my Trigonometry resources.As I add more Trigonometry resources to my store, they will get added to this bundle.There is no set deadline for future installments.I will create and upload any and all future Trigonometry resources as an as-needed basis for my perPrice $84.00Original Price $121.60Save $37.60
- If you teach both Algebra 2 and Precalculus, you will save yourself a lot of time and work when you purchase this bundle.This bundle contains oodles of activities that can be done in class or assigned for homework.Most of the resources in my Slow Growing Algebra 2 bundle and my Slow Growing PrecalcuPrice $340.00Original Price $495.60Save $155.60
Description
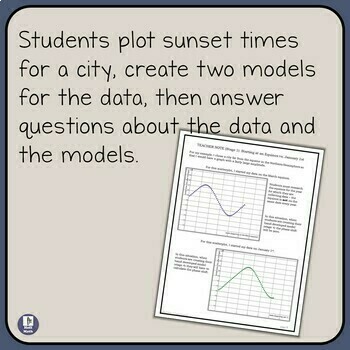
Looking for a project related to the graphs of sine functions? Look no further! In this project, students pick any city in the world, look online for the sunset times in the city over a one-year period, plot the data on a scatterplot, create two sine models that fit the data, then answer questions about the data and the models.
Includes sample data and a rubric!
Click HERE to SAVE 30% by buying my Precalculus Slow Growing Bundle. As I add more Precalculus products to my store, they will get added to this bundle. That means you get a discount on the products already included, and then you can re-download to get any future Precalculus products for FREE!
In this project students will:
- use Desmos to create a scatterplot
- write the equation of a function from real-world data that models a sine function
- use Desmos to find a sinusoidal regression equation
- discuss why a sine function best fits the real-world data
- compare and contrast the hand-developed model with the regression model
- explore the usefulness of the models in the real-world
How long do students need for this project?
If students are working individually, I would give them two or three 90-minute class periods (four or five 60-minute periods) to do this project. I recommend that you plan a flex day in case you need to extend the deadline.
Out of practice?
Has it been a while since you have written the graph of a trig function from a scatter plot? Nervous that you may not be able to correctly guide your students to be successful?
No worries! I got you!
I included very specific teacher instructions with tips and how-to's and a sample set of data.
What is included in the download:
- 2-page student instructions (NOT EDITABLE)
- a sample set of data (in Google Sheets)
- sample graphs (in Desmos)
- a NON-EDITABLE rubric to make grading as easy and seamless as possible
- 7 pages of support for the teacher including:
- How to Convert Time into Decimals in Excel or Google Sheets
- How to Copy Data from a Spreadsheet Into Desmos
- How to make a Scatter Plot in Desmos
- How to Create the Hand-Developed Model
- How to do Sine Regression in Desmos
If you like this product, leave a review (you can get tpt credits for every review you leave - and then use those credits on future tpt purchases). Also, follow my store to get notifications about new products I add to my store.
Questions or concerns? email me at rebecca@hoffmath.com

