Three FUNCTION SYSTEMS Mini Projects - Real World!
My Dogs Ate My Homework
549 Followers
Grade Levels
7th - 10th, Homeschool
Subjects
Resource Type
Standards
CCSS8.F.A.1
CCSS8.F.A.2
CCSS8.F.B.5
Formats Included
- Zip
Pages
18 pages
My Dogs Ate My Homework
549 Followers
Description
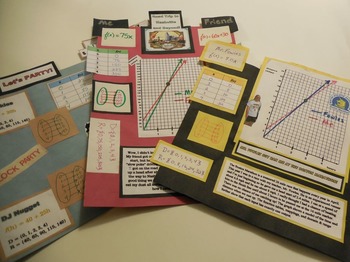
8th Grade Functions and Systems of Equations come together in an engaging, real-world project (3 mini projects)!
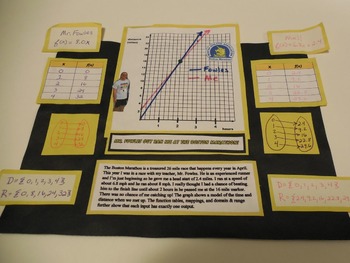
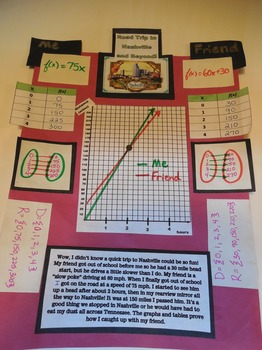
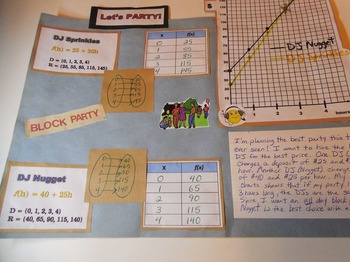
The projects require the students to create displays that include graphs, tables, domain, range, mapping, and reflection. The students write two functions in each mini project based on a possible real-world scenario. The students must not only visually display their functions in various forms, but they must explain the results and effects of small changes in the data or function.
My 8th grade students really ate this up! It is one of the few times when algebra concepts come together in authentic, everyday activities that the kids could relate to. The students came up with their own scenarios to graph! (Great extension activity for another day -maybe graphing calculator?) In order for the students to explain results, they must really understand the functions and parts of a linear equation. These projects made it real for many of my students who were struggling!
Scenario #1: Student races a teacher in the Boston Marathon
Scenario #2: Student decides cheapest DJ for a block party
Scenario #3: Student follows a friend to a nearby city
INCLUDES:
--ready-to-go student handout for each mini project
--teacher key and notes for discussion for each scenario
--PowerPoint to display when introducing or reviewing project requirements (Great with smart board) includes blank graphs and tables to help teach the concept if needed.
--pictures of completed student work
Concepts include: systems of equations, functions, slope, y-intercepts, d=rt, mapping, graphing, tables, domain and range. The students also are required to write paragraphs explaining the results and how they affect choices.
THANKS so much! Enjoy!
Total Pages
18 pages
Answer Key
Included
Teaching Duration
1 Week
Report this resource to TPT
Reported resources will be reviewed by our team. Report this resource to let us know if this resource violates TPT’s content guidelines.
Standards
to see state-specific standards (only available in the US).
CCSS8.F.A.1
Understand that a function is a rule that assigns to each input exactly one output. The graph of a function is the set of ordered pairs consisting of an input and the corresponding output.
CCSS8.F.A.2
Compare properties of two functions each represented in a different way (algebraically, graphically, numerically in tables, or by verbal descriptions). For example, given a linear function represented by a table of values and a linear function represented by an algebraic expression, determine which function has the greater rate of change.
CCSS8.F.B.5
Describe qualitatively the functional relationship between two quantities by analyzing a graph (e.g., where the function is increasing or decreasing, linear or nonlinear). Sketch a graph that exhibits the qualitative features of a function that has been described verbally.


