
Teach Basic Bar & Line Graphing in Science for Middle School


- Zip
What educators are saying
Also included in
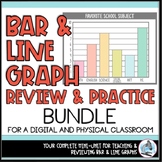 Making bar and line graphs shouldn't be difficult, especially for students at a middle school level. But I'd bet if you've ever asked your students to make a simple bar or line graph from a data table, you got a very wide range of graphs. Some graphs looked great, but others didn't even look like grPrice $5.00Original Price $6.00Save $1.00
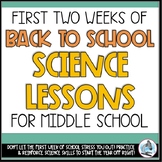 If the first day and couple weeks of school stress you out, these back to school science activities for middle school are for you!“Don’t smile until Thanksgiving.”“Spend the first day of school doing something engaging.”“Work on procedures before you work on content.” “Build relationships, but alsoPrice $15.00Original Price $19.50Save $4.50
Description
If I had to guess, your middle school students really struggle with even the most basic graphing in science. I’m right, huh?
I’ve got you! Don’t spend another minute stressing over why your students have poor graphing skills! This resource teaches five things all graphs need, plus when to use a bar graph vs a line graph. This resource is complete with a PowerPoint, guided notes, digital student notebooks, and practice graphs that will help your students succeed at graphing in science… and keep you from pulling out your hair.
Does that sound too simple for your middle school students? It’s not. I promise you, by spending a few short days giving students some common language and expectations for making graphs, you can refer back to it all year long!
This awesome resource gives you flexibility with student digital notebooks using Google Slides - just in case you need them!
You might also be interested in:
Starting small by teaching five things all graphs have and then when to use a bar graph vs a line graph, you will set your students up for success and be able to increase the rigor as they need to make more challenging graphs later.
This resource includes:
✨ An engaging, no-prep PowerPoint presentation that goes over five things all graphs have using the TAILS mnemonic, ensuring your students will always remember!
✨Student notebooks in Google Slides in widescreen format for maximum flexibility for all students and all classrooms!
✨A comparison of why and when to use bar and line graphs, including double bar graphs and double line graphs so students are capable of creating their own graphs with experimental data
✨Guided fill in the blank notes, including an accommodate version to save you time and make life a little easier
✨Simple practice graphs to complete as a class with a TAILS checklist so students can be successful and gain confidence graphing in science!
To learn more about graphing in science, check out:
How To Draw A Scientific Graph
Five Easy Tips To Make A Graph In Science
Let’s Connect!
