Tally Frequency Table Bar Graph Google Slides Worksheets digital
- Google Slides™

What educators are saying
Description
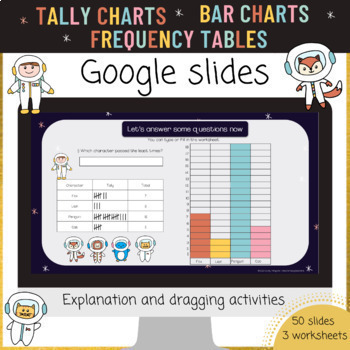
This Google Slides resource is perfect to introduce your students to recording data using tally charts, frequency tables and bar graphs. It also contains practice at answering questions about bar graphs.
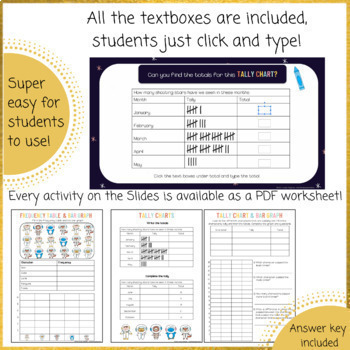
This resource is super flexible as you can choose to have each student complete everything on the digital Google Slides (moveable/ dragging pieces and textboxes are included already) or you can choose to use the worksheets which follow exactly the activities on the Google Slides.
The Slides start by students seeing a picture of many different character astronauts and they form a simple frequency table about it by counting.
Students then form a simple bar graph from this frequency table.
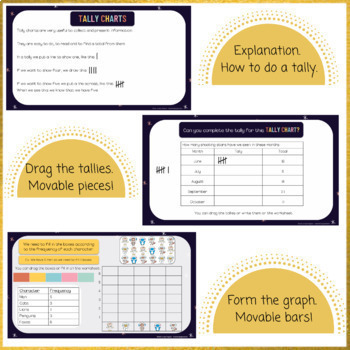
This is followed by an explanation about tally charts and how these can be more useful to record data in different situations. There is an explanation of how to form a tally chart and students practice forming tallies by dragging on the slides or on the worksheets. Student will also be asked to find totals from tallies.
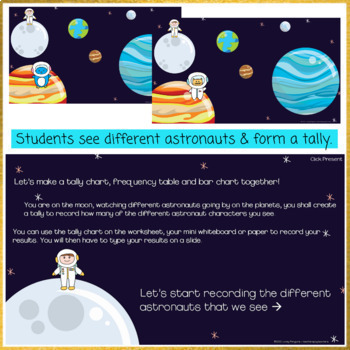
This all leads to a super fun activity which your students are sure to enjoy. They will see the different astronaut characters on the planets as they go through the slides. Students will need to record a tally for this. They will then find totals, complete the bar graph and answer questions. Students can complete every activity on the Slides or on the worksheets.
The activities on the PowerPoint come with answer key slides which can be kept to help students to check their work or can be easily deleted if you wish.
What's included:
⭐Google slides with 50 slides (containing all the explanations, activities and answer key)
⭐3 printable PDF worksheets.
⭐Worksheets answer key.
Be sure to follow my store for update about new products CLICK HERE
Don't forget to leave feedback, this will give you TPT CREDIT for your future purchases!


