Student NWEA MAP Data Graphs
Teaching the Individual
12 Followers
Grade Levels
K - 12th
Subjects
Resource Type
Formats Included
- PDF
Pages
99 pages
Teaching the Individual
12 Followers
What educators are saying
This works great for tracking MAP data and Iove that the graphs identify the norm scores so students can compared themselves to the mean score. Great resource!
Description
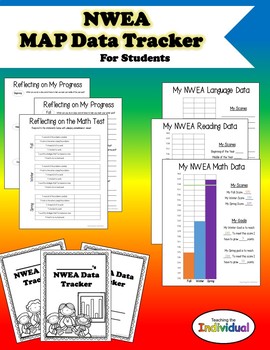
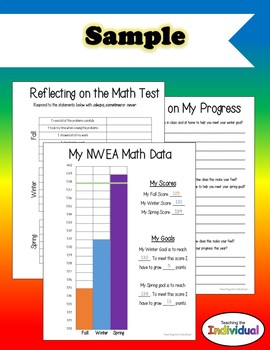
Easily allow your students to track their NWEA MAP data and goals throughout the year using a bar graph.
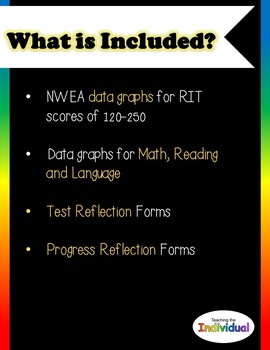
Multiple bar graphs are included that span 20 RIT points. The graphs range from 120-250 RIT Range. Grade level recommendations are included based off of the 2015 NWEA norms. However, feel free to use whichever graphs work best for your students. Blank graphs are also included. :)
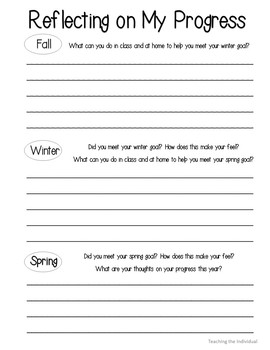
Test and student progress reflection sheets are included. These allow your students to reflect on their effort while taking the test and performance on the test.
Want to track data for the entire class on one sheet? Need a class form to add to your data binder? Check out my Class Tracker.
Total Pages
99 pages
Answer Key
N/A
Teaching Duration
N/A
Report this resource to TPT
Reported resources will be reviewed by our team. Report this resource to let us know if this resource violates TPT’s content guidelines.


