Statistics and Probability CCSS checklist (trimesters)
pi B squared
20 Followers
Grade Levels
9th - 12th, Homeschool, Staff
Subjects
Resource Type
Standards
CCSSHSS-ID.A.1
CCSSHSS-IC.A.2
CCSSHSS-CP.A.3
CCSSHSS-MD.A.4
Formats Included
- PDF
Pages
4 pages
pi B squared
20 Followers
Description
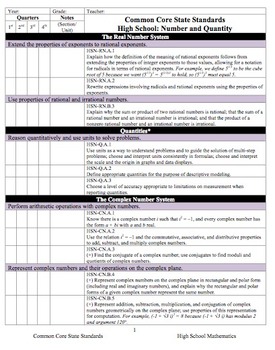
This document is a checklist for the Statistics and Probability Common Core State Standards framework. There are multiple columns included to be able to use this document as a checklist for which common core standards you have taught within your course(s) and a column to notate when, how, where you used each standard. This is very useful for planning and implementation of curriculum on an annual basis.
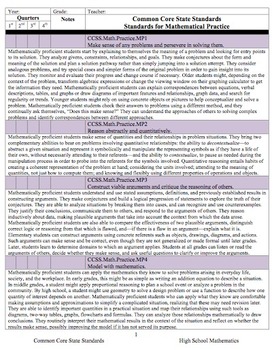
Included in the document are the Standards for Mathematical Practice as well as the CCSS framework for Statistics and Probability.
For Standards-based Curriculum schools, print one copy per student (or keep electronically). For Standards-referenced Curriculum schools, keep one copy per class taught. This serves as good documentation for parents and administration of the curriculum implemented within the classroom, as well as will be valuable when planning a curriculum framework, planning calendar, or syllabus for a course.
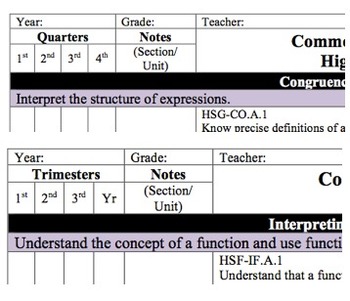
The checklist format can be used by writing in the date(s) that the standard was taught and/or checking the box of to show completion. This checklist is divided up into trimesters. It is also available using four marking periods (quarters). For a custom format, please feel free to email Rebecca Binkley at rbinkley314@gmail.com.
Checklists are also available as a full packet.
Total Pages
4 pages
Answer Key
N/A
Teaching Duration
N/A
Report this resource to TPT
Reported resources will be reviewed by our team. Report this resource to let us know if this resource violates TPT’s content guidelines.
Standards
to see state-specific standards (only available in the US).
CCSSHSS-ID.A.1
Represent data with plots on the real number line (dot plots, histograms, and box plots).
CCSSHSS-IC.A.2
Decide if a specified model is consistent with results from a given data-generating process, e.g., using simulation. For example, a model says a spinning coin falls heads up with probability 0.5. Would a result of 5 tails in a row cause you to question the model?
CCSSHSS-CP.A.3
Understand the conditional probability of 𝘈 given 𝘉 as 𝘗(𝘈 and 𝘉)/𝘗(𝘉), and interpret independence of 𝘈 and 𝘉 as saying that the conditional probability of 𝘈 given 𝘉 is the same as the probability of 𝘈, and the conditional probability of 𝘉 given 𝘈 is the same as the probability of 𝘉.
CCSSHSS-MD.A.4
Develop a probability distribution for a random variable defined for a sample space in which probabilities are assigned empirically; find the expected value. For example, find a current data distribution on the number of TV sets per household in the United States, and calculate the expected number of sets per household. How many TV sets would you expect to find in 100 randomly selected households?


