Statistical Investigation Graphing and Analyzing COOKIE Data!
MathyCathy
1.5k Followers
Grade Levels
4th - 9th, Adult Education, Homeschool
Subjects
Resource Type
Formats Included
- PDF
Pages
5 pages
MathyCathy
1.5k Followers
Description
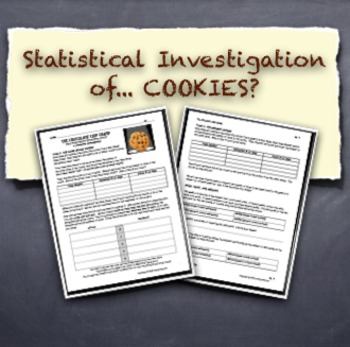
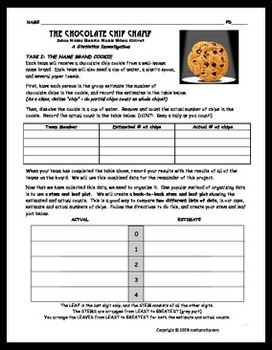
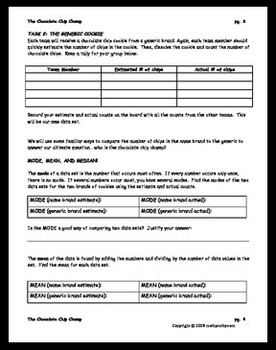
Does name brand mean more chocolate chips? That is the question that fuels this entire statistical investigation! Students gather chip data from actual cookies, analyzing and graphing it along the way. By the end of the investigation, students will have explored mean, median, mode, range, back-to-back stem-and-leaf plots, double bar graphs, box-and-whisker plots, and the idea of estimating. All cookies involved will be destroyed... but it's all worth it!
Total Pages
5 pages
Answer Key
N/A
Teaching Duration
1 Week
Report this resource to TPT
Reported resources will be reviewed by our team. Report this resource to let us know if this resource violates TPT’s content guidelines.


