Standard deviation: Application in science. Lesson + workbook
Adampo's science resources
3 Followers
Grade Levels
9th - 12th, Homeschool
Subjects
Resource Type
Standards
CCSSHSS-ID.A.2
CCSSHSS-ID.A.4
Formats Included
- Zip
Pages
36 Powerpoint + 16 page workbook
Adampo's science resources
3 Followers
Also included in
- Bundle of resources covering statistics in science:Standard deviationChi-squared testT-testEach resource has a full powerpoint lesson and a workbook for students to use alongside.Structure of the lessons:Do now starter activityBackground knowledgeAssessment for learning (AfL) to check for understandPrice $12.00Original Price $15.00Save $3.00
Description
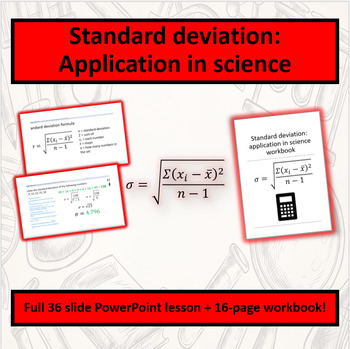
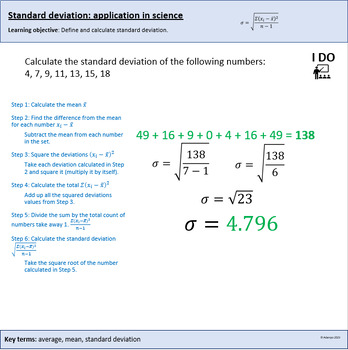
Complete standard deviation. Easy to use and follow PowerPoint. Simplifying standard deviation for students with step-by-step worked standard deviation calculations.
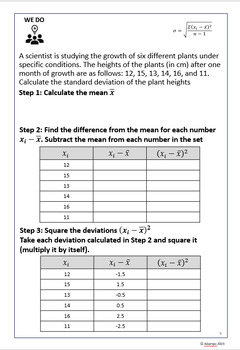
The accompanying workbook is aligned with the PowerPoint. It reinforces learning with exercises, ensuring students grasp the concepts independently.
The focus of the resource is the application of standard deviation and interpretation of results rather than explaining the concept in detail.
It can be used as a pure maths resource in addition to science lessons. Perfect for homeschooling as well.
Lesson objectives:
- Define the mean.
- Calculate the mean of a set of numbers.
- Define standard deviation.
- Calculate standard deviation.
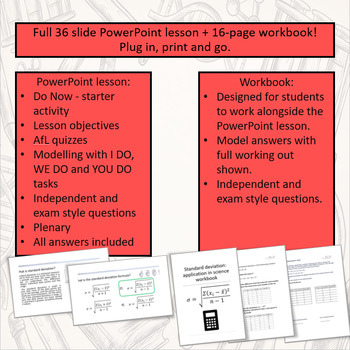
36 slide PowerPoint contents:
- Do now starter questions
- Introduction to the mean and standard deviation
- Low stakes quizzing to check understanding
- Application of knowledge (I DO, WE DO, YOU DO) - worked examples
- Independent task and exam style questions
- Plenary
- Full answers
16 page workbook contents:
- Key notes
- I DO - Worked teacher example
- WE DO - Scaffolded example
- YOU DO and independent task - Students work though independently
- Exam style questions - Students apply learning
Head over to my store for more science resources.
All the best,
Adampo
Total Pages
36 Powerpoint + 16 page workbook
Answer Key
Included
Teaching Duration
90 minutes
Report this resource to TPT
Reported resources will be reviewed by our team. Report this resource to let us know if this resource violates TPT’s content guidelines.
Standards
to see state-specific standards (only available in the US).
CCSSHSS-ID.A.2
Use statistics appropriate to the shape of the data distribution to compare center (median, mean) and spread (interquartile range, standard deviation) of two or more different data sets.
CCSSHSS-ID.A.4
Use the mean and standard deviation of a data set to fit it to a normal distribution and to estimate population percentages. Recognize that there are data sets for which such a procedure is not appropriate. Use calculators, spreadsheets, and tables to estimate areas under the normal curve.

