Standard Form to Slope Intercept Form Worksheet
- PDF
What educators are saying
Also included in
- Eight math worksheets targeting widely tested state math standards focusing on graphing concepts including intercepts, solutions, slope-intercept, and interpreting slope-intercept form. Each include a printable PDF, Four include corresponding Easel Activities.Slope Intercept Word problems Matching WPrice $14.99Original Price $19.00Save $4.01
Description
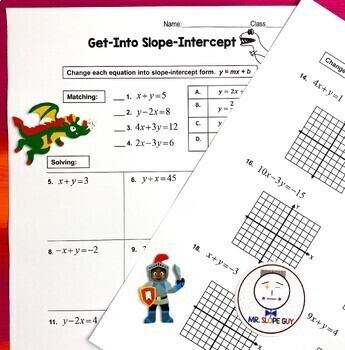
Attention Math Teachers! If you're looking for a comprehensive worksheet on converting equations from standard form to slope-intercept form and graphing them on the coordinate plane, you're in the right place. Our activity is perfect for students in Pre-Algebra or as a review for Algebra 1.
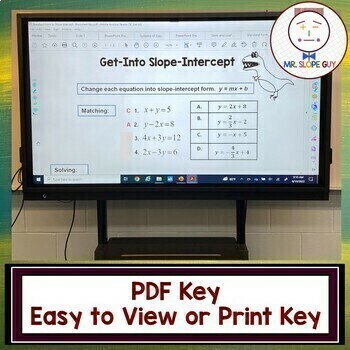
This two-sided worksheet comes with an easy-to-use answer key, making it a great in-class activity or homework assignment. By mastering this essential skill, your students will be able to rearrange formulas to solve for a given variable, using the y = mx + b equation.
Download our worksheet today and start helping your students build a solid math foundation.
Compatibility
For optimal use, I highly recommend printing this resource. While digital tools can be incredibly useful in many contexts, some of the questions in this resource involve tasks that are best completed with pencil and paper. Printed versions of the resource provide students with the physical space they need to work through these tasks and fully engage with the material.
Instructional Math Video
In order to provide the best possible learning experience for your students, I've included a QR code link to a video that I created to assist with using this worksheet. While the video is not professionally produced, it can be an incredibly helpful tool for students who are learning remotely, were absent during the activity, or are homeschooling. Additionally, it can serve as a substitute lesson plan in case of unexpected absences or classroom disruptions.
The video includes several examples and provides step-by-step instructions that can help students complete the activity successfully. By offering this additional resource, we hope to provide your students with the support they need to master the concepts covered in the worksheet.
Math Standards
Common Core Standards: 8.EE.6.6, 8.EE.6.10, 8.F.A.3, 8.F.B.4, HSA-CED.A.4 Distinguish between different forms of equations, including direct variation, slope-intercept form and standard form. Explain what is meant by the term equivalent equations. Convert from one form of equation to another. Tell when each form is useful and how to graph using each form. Florida's B.E.S.T. math standards: MA.8.AR.3.3 Given a table, graph or written description of a linear relationship, write an equation in slope-intercept form. MA.8.AR.3.4 Given a mathematical or real-world context, graph a two-variable linear equation from a written description, a table or an equation in slope-intercept form. MA.8.AR.3.5 Given a real-world context, determine and interpret the slope and -intercept of a two-variable linear equation from a written description, a table, a graph or an equation in slope-intercept form. MA.912.AR.2.2 Includes the use of standard form, slope-intercept form and point-slope form, and the conversion between these forms.
Check out my other Graphing PDF Worksheets:
Slope Intercept Graphing Worksheet
Domain Range & Function Worksheet
Mr. Slope Guy
Teacher Feedback
"I love all of your resources. I love the addition of video content. Straightforward. Thank you!"
"Excellent resource and easy to use! Thank you!"
"My students loved it! Great visual for students who have difficulty."
"Great review for graphing lines as well as changing equations from standard to slope-intercept form. My students enjoyed this activity."
LICENSING TERMS: This purchase includes a license for one teacher only for personal use in their classroom. Licenses are non-transferable, meaning they cannot be passed from one teacher to another. No part of this resource is to be shared with colleagues or used by an entire grade level, school, or district without purchasing the proper number of licenses. If you have any questions, please contact me at MrSlopeGuy@gmail.com.
COPYRIGHT TERMS: This resource may not be uploaded to the internet in any form, including classroom/personal websites or network drives, unless the site is password protected and can only be accessed by students.


