
Slope-Intercept Form MINI-BUNDLE

- Zip
- Google Apps™
- Easel Activity

Products in this Bundle (5)
Also included in
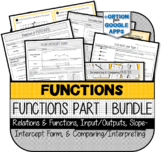 This mini-bundle contains Notes, Practice, Test Practice, Activities, & Assessments for the following topics:1) Introduction to Functions (Inputs/Outputs)2) Relations & Functions3) Introduction to Slope4) Slope-Intercept Form5) Comparing Functions in Different Formats6) Interpreting Rate ofPrice $24.50Original Price $35.00Save $10.50
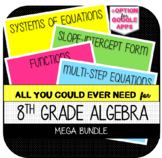 NOTE: Google Apps Options - Only the ASSESSMENTS and a few other specified activities have Google Apps options. This bundle is NOT ideal for "Distance Learning" unless you have special access to PDF editors that remove answer keys, etc.This product includes:1) Notes2) Practice3) Games4) Activities5)Price $68.00Original Price $89.00Save $21.00
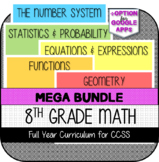 Does your state have additional standards that are not included in this resource? Email me at tptmathcafe@gmail.com for supplemental resourcesNOTE: Google Apps Options - Only the ASSESSMENTS and a few other specified activities have Google Apps options. This curriculum is NOT ideal for "Distance LeaPrice $175.00Original Price $272.99Save $97.99
Description
NOTE: Google Apps Options - Only the ASSESSMENTS have Google Apps options. This bundle is NOT ideal for "Distance Learning" unless you have special access to PDF editors that remove answer keys, etc.
This resource was developed to assess the requirements of the 8th Grade Functions Standards below:
CCSS.MATH.CONTENT.8.F.A.2
Compare properties of two functions each represented in a different way (algebraically, graphically, numerically in tables, or by verbal descriptions). For example, given a linear function represented by a table of values and a linear function represented by an algebraic expression, determine which function has the greater rate of change.
CCSS.MATH.CONTENT.8.F.B.4
Construct a function to model a linear relationship between two quantities. Determine the rate of change and initial value of the function from a description of a relationship or from two (x, y) values, including reading these from a table or from a graph. Interpret the rate of change and initial value of a linear function in terms of the situation it models, and in terms of its graph or a table of values
See individual details of the resources included.
LICENSING TERMS: This purchase includes a license for one teacher only for personal use in their classroom. Licenses are non-transferable, meaning they can not be passed from one teacher to another. No part of this resource is to be shared with colleagues or used by an entire grade level, school, or district without purchasing the proper number of licenses.
COPYRIGHT TERMS: This resource may not be uploaded to the internet in any form, including classroom/personal websites or network drives, unless the site is password protected and can only be accessed by students.
