Slope Intercept Form Equation Posters and Math Bulletin Board
- PDF
Also included in
- Your Middle School Math Classroom bulletin boards and walls are going to look amazing! And more importantly, your students will be surrounded by important math references to support their learning with this bundle of math classroom decor and math posters.Purchase this GROWING BUNDLE today to save evPrice $27.50Original Price $46.97Save $19.47
Description
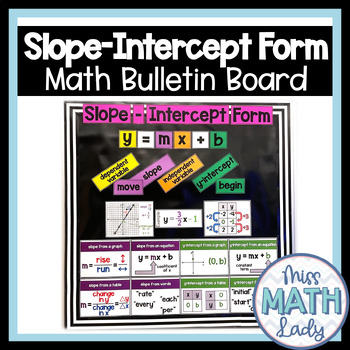
This Slope Intercept Form Equation Posters and Bulletin Board is a great addition to your middle school or high school Math Classroom Decor. Display this on a bulletin board or on a wall to reinforce linear relationships in the format of y=mx+b. Just print, cut, and assemble!
Includes:
- Title
- Parts of the equation (y, =, m, etc.)
- Meanings of the equation parts (dependent variable, slope, etc.)
- Slope from... (how to find from a graph, table, etc.)
- y-intercept from... (how to find from a graph, table, etc.)
- Two examples (1 with a positive slope and negative y-intercept AND 1 with a negative slope and a positive y-intercept) from a table, graph, and equation
You choose the color of the paper for all of the pieces. 8.5-inch by 11-inch, cardstock paper is recommended for extra durability but any letter-size paper works. You can use black ink and/or color ink.
For reference, the bulletin board shown in the photo is about 4 feet tall by 4 feet wide, including the border placed around the perimeter.
Looking for MORE Classroom Decor? You might also like:
Do you have a question about this resource? Please email me: cassie@missmathlady.com


