TPT
Total:
$0.00

Skittles Sorting, Graphing, and Analyzing Data | Rainbow Color Graphing

Rated 4.92 out of 5, based on 422 reviews
4.9 (422 ratings)
;
Erica Bohrer
37.4k Followers
Grade Levels
K - 2nd, Homeschool
Standards
Formats Included
  • PDF
Pages
11 pages
$3.00
$3.00
Share this resource
Report this resource to TPT
Erica Bohrer
37.4k Followers

What educators are saying

This was a great introduction lesson to graphing that engaged the students and got them excited to learn about sorting and graphing!!
Exactly what I was looking for to give my students a hands on experience with graphing! They stayed motivated and excited the entire time!

Description

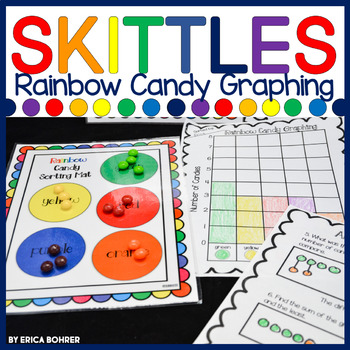
This rainbow candy sorting, graphing, tallying, and analyzing data activity is a fun way to reinforce math concepts. The resource is meant to use with fun-sized Skittles rainbow candies. It is common core aligned for first and second grade.

This graphing math activity would be so fun to do around St Patrick's Day or during a rainbow or graphing unit!

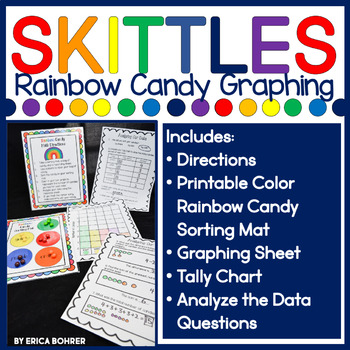
This Skittles Sorting, Graphing, and Tallying Math Resource Includes:

  • Teacher Directions
  • Student Directions
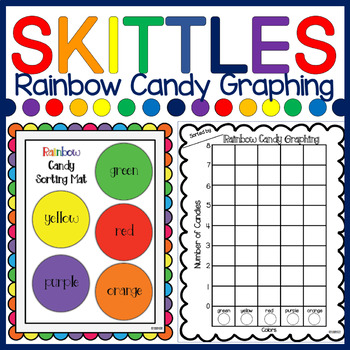
  • Printable color sorting mats
  • Bar graph
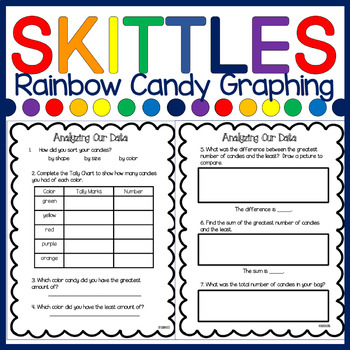
  • Tally Chart
  • Student questions based upon the bar graph data

⭐⭐⭐⭐⭐"This is going to be a perfect attention-grabber at the beginning of out graphing unit. Thank you!" -April J.

⭐⭐⭐⭐⭐"My students were so engaged in learning with this resource. A simple way to make graphing fun!" -Hannah L.

Let's Stay Connected:

Please, follow my store to get updates of new and free items. You can also find more teaching ideas on my blog and through Facebook, Pinterest, & Instagram.

Check out this BLOG POST for St. Patrick's Day Freebies and more!

Happy Teaching!

-Erica Bohrer

Total Pages
11 pages
Answer Key
N/A
Teaching Duration
N/A
Report this resource to TPT
Reported resources will be reviewed by our team. Report this resource to let us know if this resource violates TPT’s content guidelines.

Standards

to see state-specific standards (only available in the US).
Classify objects into given categories; count the numbers of objects in each category and sort the categories by count.
Organize, represent, and interpret data with up to three categories; ask and answer questions about the total number of data points, how many in each category, and how many more or less are in one category than in another.
Draw a picture graph and a bar graph (with single-unit scale) to represent a data set with up to four categories. Solve simple put-together, take-apart, and compare problems using information presented in a bar graph.

Reviews

Questions & Answers

37.4k Followers