Skittles Graphing - Line Plot, Bar Graph, Picture Graph Math Project
Dragonfly Lettering
42 Followers
Grade Levels
K - 5th
Subjects
Resource Type
Standards
CCSSK.CC.B.4a
CCSSK.MD.B.3
CCSS1.MD.C.4
CCSS2.MD.D.9
CCSS2.MD.D.10
Formats Included
- PDF
Pages
10 pages
Dragonfly Lettering
42 Followers
What educators are saying
My students were highly engaged and they loved being able to use the skills they have learned and apply it to candy. Thank you for the perfect activity to end our graphing unit.
Description
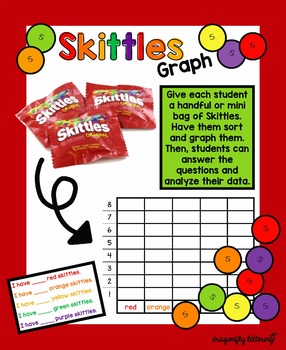
Graphing Skittles
Give each student a mini bag of Skittles or a handful of Skittles to sort, graph, and analyze the data.
Use these No PREP templates to create a fun project!
Students will love that it involves candy and you will love that it involves math!
This file includes:
- 4 graphing templates - differentiated questioning - one geared towards Kindergarten and 1st, and one geared towards 2nd-4th grade.
- Graphing templates suited for bar graphs, picture graphs, and line plots.
- Skittles cut-outs for picture graphs
For more great products, click this link.
When you leave a review, you'll earn 1 credit for every $1 you spent on TPT for that resource.
Total Pages
10 pages
Answer Key
N/A
Teaching Duration
N/A
Report this resource to TPT
Reported resources will be reviewed by our team. Report this resource to let us know if this resource violates TPT’s content guidelines.
Standards
to see state-specific standards (only available in the US).
CCSSK.CC.B.4a
When counting objects, say the number names in the standard order, pairing each object with one and only one number name and each number name with one and only one object.
CCSSK.MD.B.3
Classify objects into given categories; count the numbers of objects in each category and sort the categories by count.
CCSS1.MD.C.4
Organize, represent, and interpret data with up to three categories; ask and answer questions about the total number of data points, how many in each category, and how many more or less are in one category than in another.
CCSS2.MD.D.9
Generate measurement data by measuring lengths of several objects to the nearest whole unit, or by making repeated measurements of the same object. Show the measurements by making a line plot, where the horizontal scale is marked off in whole-number units.
CCSS2.MD.D.10
Draw a picture graph and a bar graph (with single-unit scale) to represent a data set with up to four categories. Solve simple put-together, take-apart, and compare problems using information presented in a bar graph.


