Simulations
BeachTeachShop
37 Followers
Grade Levels
7th - 8th
Subjects
Resource Type
Standards
CCSS7.SP.A.1
CCSS7.SP.A.2
CCSS7.SP.B.4
CCSS7.SP.C.6
CCSS7.SP.C.8c
Formats Included
- PDF
- Google Apps™
Pages
10 pages
BeachTeachShop
37 Followers

Includes Google Apps™
The Teacher-Author indicated this resource includes assets from Google Workspace (e.g. docs, slides, etc.).
Description
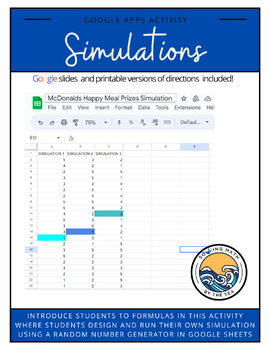
Students will use Google Sheets and a random number generator to run their own simulation.
Skills include:
- writing a formula in Google Sheets
- creating a random number generator
- analyzing simulation results
- relating simulations to real-world occupations
Total Pages
10 pages
Answer Key
Does not apply
Teaching Duration
N/A
Last updated 7 months ago
Report this resource to TPT
Reported resources will be reviewed by our team. Report this resource to let us know if this resource violates TPT’s content guidelines.
Standards
to see state-specific standards (only available in the US).
CCSS7.SP.A.1
Understand that statistics can be used to gain information about a population by examining a sample of the population; generalizations about a population from a sample are valid only if the sample is representative of that population. Understand that random sampling tends to produce representative samples and support valid inferences.
CCSS7.SP.A.2
Use data from a random sample to draw inferences about a population with an unknown characteristic of interest. Generate multiple samples (or simulated samples) of the same size to gauge the variation in estimates or predictions. For example, estimate the mean word length in a book by randomly sampling words from the book; predict the winner of a school election based on randomly sampled survey data. Gauge how far off the estimate or prediction might be.
CCSS7.SP.B.4
Use measures of center and measures of variability for numerical data from random samples to draw informal comparative inferences about two populations. For example, decide whether the words in a chapter of a seventh-grade science book are generally longer than the words in a chapter of a fourth-grade science book.
CCSS7.SP.C.6
Approximate the probability of a chance event by collecting data on the chance process that produces it and observing its long-run relative frequency, and predict the approximate relative frequency given the probability. For example, when rolling a number cube 600 times, predict that a 3 or 6 would be rolled roughly 200 times, but probably not exactly 200 times.
CCSS7.SP.C.8c
Design and use a simulation to generate frequencies for compound events. For example, use random digits as a simulation tool to approximate the answer to the question: If 40% of donors have type A blood, what is the probability that it will take at least 4 donors to find one with type A blood?


